33
/de/
AIzaSyAYiBZKx7MnpbEhh9jyipgxe19OcubqV5w
August 1, 2025
87710
Bolivia
BOL
true
2
1
Percentage of enrolment in secondary education in private institutions (%)
2014,2013,2012,2011,2010,2009,2008,2007,2003,2002,2001
Download
Bibliothek der Globalstatistik →Bolivia →

Percentage of enrolment in secondary education in private institutions (%)

Diese Statistik in anderen Ländern:

AfghanistanAlbaniaAlgeriaAndorraAngolaAntigua and BarbudaArab WorldArgentinaArmeniaArubaAustraliaAustriaAzerbaijanBahamas, TheBahrainBangladeshBarbadosBelarusBelgiumBelizeBeninBermudaBhutanBoliviaBosnia and HerzegovinaBotswanaBrazilBritish Virgin IslandsBrunei DarussalamBulgariaBurkina FasoBurundiCabo VerdeCambodiaCameroonCanadaCaribbean small statesCayman IslandsCentral African RepublicCentral Europe and the BalticsChadChileChinaColombiaComorosCongo, Dem. Rep.Congo, Rep.Costa RicaCote d'IvoireCroatiaCuracaoCyprusCzech RepublicDenmarkDjiboutiDominicaDominican RepublicEarly-demographic dividendEast Asia & PacificEast Asia & Pacific (excluding high income)East Asia & Pacific (IDA & IBRD countries)EcuadorEgypt, Arab Rep.El SalvadorEquatorial GuineaEritreaEstoniaEthiopiaEuro areaEurope & Central AsiaEurope & Central Asia (excluding high income)Europe & Central Asia (IDA & IBRD countries)European UnionFijiFinlandFragile and conflict affected situationsFranceGabonGeorgiaGermanyGhanaGibraltarGreeceGrenadaGuatemalaGuineaGuinea-BissauGuyanaHeavily indebted poor countries (HIPC)High incomeHondurasHong Kong SAR, ChinaHungaryIBRD onlyIcelandIDA & IBRD totalIDA blendIDA onlyIDA totalIndiaIndonesiaIran, Islamic Rep.IrelandIsraelItalyJamaicaJapanJordanKazakhstanKenyaKorea, Rep.KuwaitKyrgyz RepublicLao PDRLate-demographic dividendLatin America & Caribbean Latin America & Caribbean (excluding high income)Latin America & the Caribbean (IDA & IBRD countries)LatviaLeast developed countries: UN classificationLebanonLesothoLiberiaLibyaLiechtensteinLithuaniaLow & middle incomeLow incomeLower middle incomeLuxembourgMacao SAR, ChinaMacedonia, FYRMadagascarMalawiMalaysiaMaldivesMaliMaltaMarshall IslandsMauritaniaMauritiusMexicoMiddle East & North AfricaMiddle East & North Africa (excluding high income)Middle East & North Africa (IDA & IBRD countries)Middle incomeMoldovaMonacoMongoliaMontenegroMoroccoMozambiqueMyanmarNamibiaNauruNepalNetherlandsNew ZealandNicaraguaNigerNigeriaNorth AmericaNorwayOECD membersOmanOther small statesPacific island small statesPakistanPalauPanamaPapua New GuineaParaguayPeruPhilippinesPolandPortugalPost-demographic dividendPre-demographic dividendPuerto RicoQatarRomaniaRussian FederationRwandaSamoaSao Tome and PrincipeSaudi ArabiaSenegalSerbiaSeychellesSierra LeoneSingaporeSint Maarten (Dutch part)Slovak RepublicSloveniaSmall statesSolomon IslandsSouth AfricaSouth AsiaSouth Asia (IDA & IBRD)SpainSri LankaSt. Kitts and NevisSt. LuciaSt. Vincent and the GrenadinesSub-Saharan Africa Sub-Saharan Africa (excluding high income)Sub-Saharan Africa (IDA & IBRD countries)SudanSurinameSwazilandSwedenSwitzerlandSyrian Arab RepublicTajikistanTanzaniaThailandTimor-LesteTogoTongaTunisiaTurkeyTurks and Caicos IslandsTuvaluUgandaUkraineUnited Arab EmiratesUnited KingdomUnited StatesUpper middle incomeUruguayVanuatuVenezuela, RBWest Bank and GazaWorldYemen, Rep.Zimbabwe

Zeitlinie:

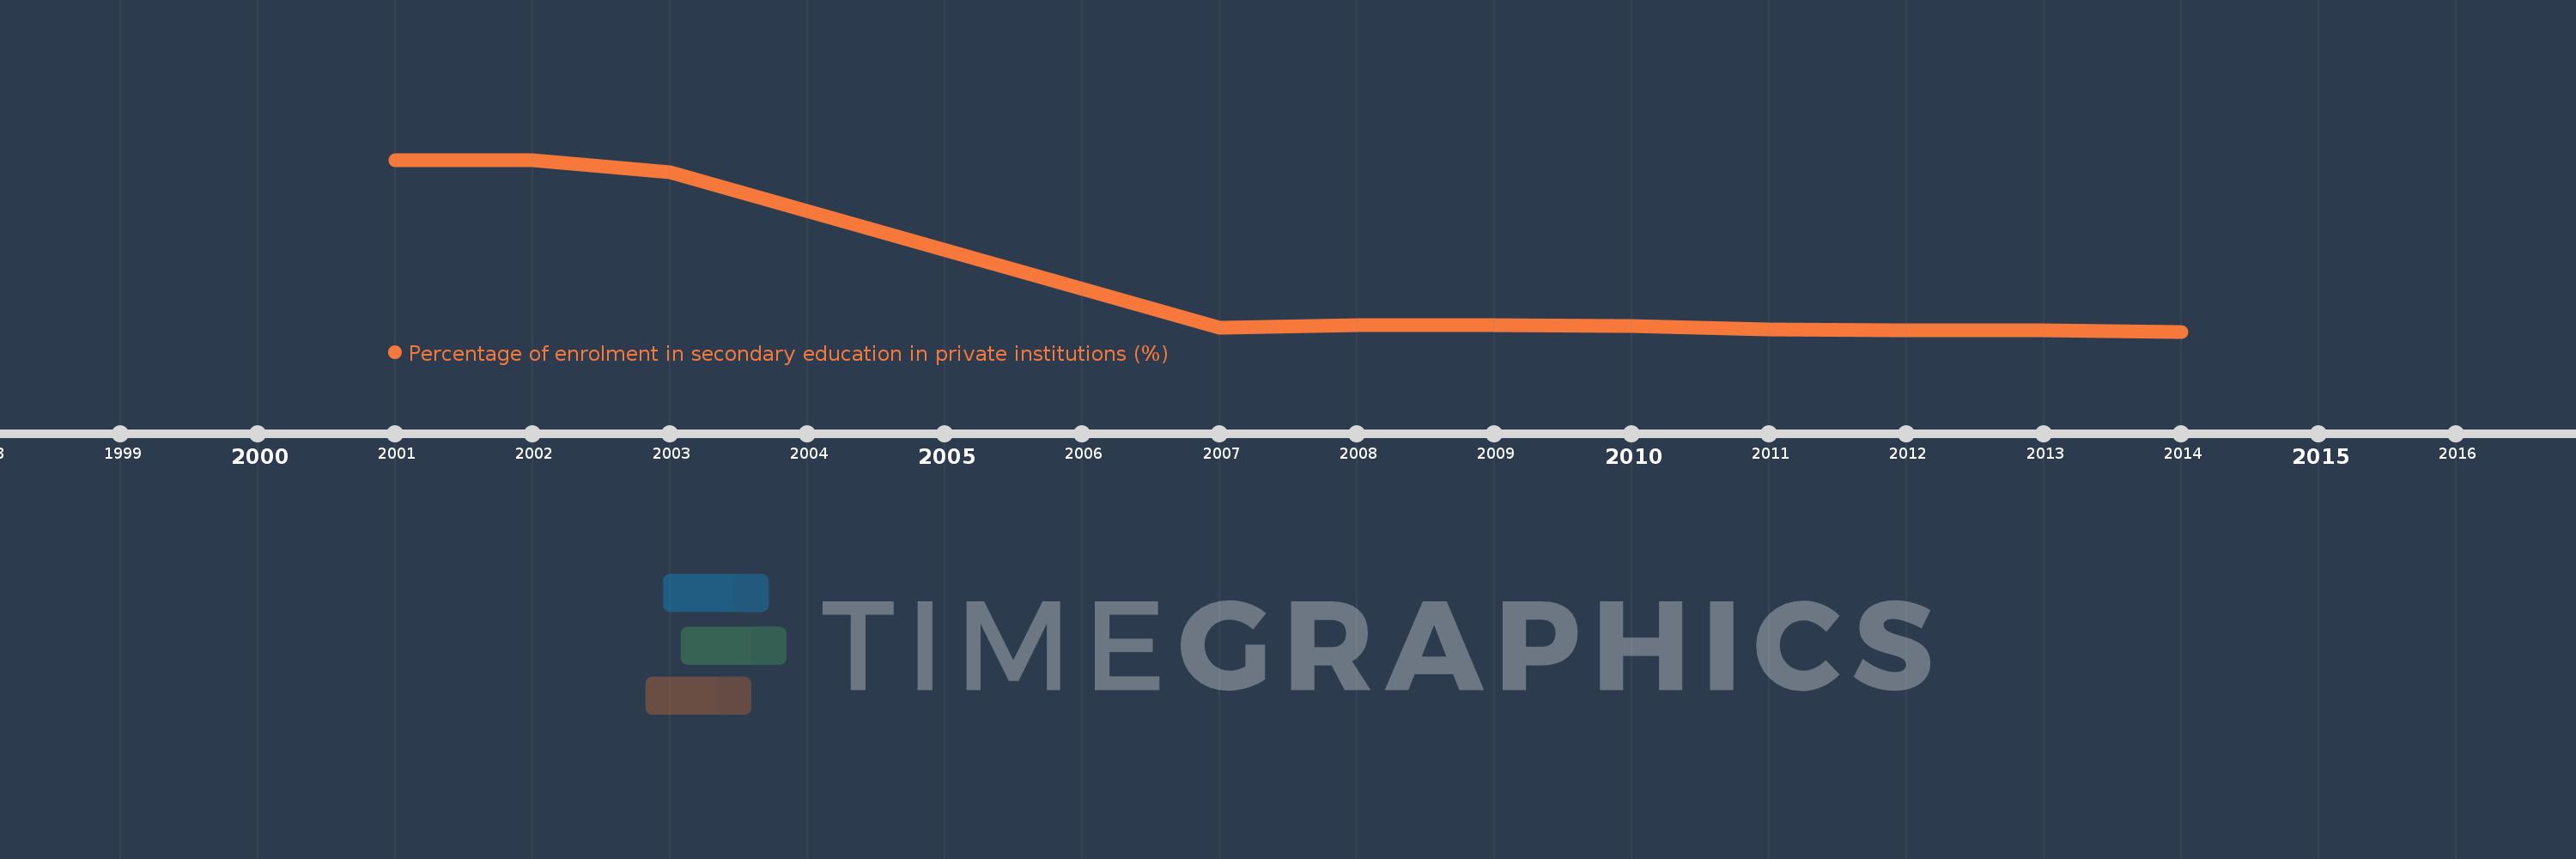
Diese Zeitleiste vorliegt die Graphik ab 2001 J. bis 2014 J. Bolivia. Die Angaben bis 2000 J. sind nicht vorhanden. Die Zahl aktueller Beobachtungen nach Daten: 11.

Die Quelle (Bezeichnung):

Kennzahlen der Weltentwicklung

Die Quelle (Einrichtung):

UNESCO Institute for Statistics

Kategorien:

Education

Es wurde aktualisiert:

23 Apr 2017 Jahr

Kennzahlen der Wertänderungen vom Jahr zum Jahr

im Durchschnitt:
17.473
Minimum:
12.915
1 Jan 2014 Jahr
Maximum:
29.185
1 Jan 2001 Jahr
Zum Datum der Beobachtung
Wert
Absolute Veränderung
Die Veränderung bezüglich dem vorherigen Wert
1 Jan 2001 Jahr
29.185
+29.185
0.0%
1 Jan 2002 Jahr
29.165
-0.02
-0.07%
1 Jan 2003 Jahr
28.027
-1.139
-3.9%
1 Jan 2007 Jahr
13.243
-14.784
-52.75%
1 Jan 2008 Jahr
13.492
+0.249
1.88%
1 Jan 2009 Jahr
13.517
+0.026
0.19%
1 Jan 2010 Jahr
13.444
-0.073
-0.54%
1 Jan 2011 Jahr
13.099
-0.345
-2.57%
1 Jan 2012 Jahr
13.05
-0.049
-0.37%
1 Jan 2013 Jahr
13.068
+0.018
0.14%
1 Jan 2014 Jahr
12.915
-0.153
-1.17%

Bewertung der Länder gemäß mit laufender Statistik nach Jahren