29
/de/
de
AIzaSyAYiBZKx7MnpbEhh9jyipgxe19OcubqV5w
April 1, 2024
164120
Japan
JPN
true
2
1
Percentage of enrolment in secondary education in private institutions (%)
2014,2013,2012,2011,2010,2009,2008,2007,2006,2005,2004,2003,2002,2001
Download
Bibliothek der Globalstatistik →Japan →

Percentage of enrolment in secondary education in private institutions (%)

Diese Statistik in anderen Ländern:
AfghanistanAlbaniaAlgeriaAndorraAngolaAntigua and BarbudaArab WorldArgentinaArmeniaArubaAustraliaAustriaAzerbaijanBahamas, TheBahrainBangladeshBarbadosBelarusBelgiumBelizeBeninBermudaBhutanBoliviaBosnia and HerzegovinaBotswanaBrazilBritish Virgin IslandsBrunei DarussalamBulgariaBurkina FasoBurundiCabo VerdeCambodiaCameroonCanadaCaribbean small statesCayman IslandsCentral African RepublicCentral Europe and the BalticsChadChileChinaColombiaComorosCongo, Dem. Rep.Congo, Rep.Costa RicaCote d'IvoireCroatiaCuracaoCyprusCzech RepublicDenmarkDjiboutiDominicaDominican RepublicEarly-demographic dividendEast Asia & PacificEast Asia & Pacific (excluding high income)East Asia & Pacific (IDA & IBRD countries)EcuadorEgypt, Arab Rep.El SalvadorEquatorial GuineaEritreaEstoniaEthiopiaEuro areaEurope & Central AsiaEurope & Central Asia (excluding high income)Europe & Central Asia (IDA & IBRD countries)European UnionFijiFinlandFragile and conflict affected situationsFranceGabonGeorgiaGermanyGhanaGibraltarGreeceGrenadaGuatemalaGuineaGuinea-BissauGuyanaHeavily indebted poor countries (HIPC)High incomeHondurasHong Kong SAR, ChinaHungaryIBRD onlyIcelandIDA & IBRD totalIDA blendIDA onlyIDA totalIndiaIndonesiaIran, Islamic Rep.IrelandIsraelItalyJamaicaJapanJordanKazakhstanKenyaKorea, Rep.KuwaitKyrgyz RepublicLao PDRLate-demographic dividendLatin America & Caribbean Latin America & Caribbean (excluding high income)Latin America & the Caribbean (IDA & IBRD countries)LatviaLeast developed countries: UN classificationLebanonLesothoLiberiaLibyaLiechtensteinLithuaniaLow & middle incomeLow incomeLower middle incomeLuxembourgMacao SAR, ChinaMacedonia, FYRMadagascarMalawiMalaysiaMaldivesMaliMaltaMarshall IslandsMauritaniaMauritiusMexicoMiddle East & North AfricaMiddle East & North Africa (excluding high income)Middle East & North Africa (IDA & IBRD countries)Middle incomeMoldovaMonacoMongoliaMontenegroMoroccoMozambiqueMyanmarNamibiaNauruNepalNetherlandsNew ZealandNicaraguaNigerNigeriaNorth AmericaNorwayOECD membersOmanOther small statesPacific island small statesPakistanPalauPanamaPapua New GuineaParaguayPeruPhilippinesPolandPortugalPost-demographic dividendPre-demographic dividendPuerto RicoQatarRomaniaRussian FederationRwandaSamoaSao Tome and PrincipeSaudi ArabiaSenegalSerbiaSeychellesSierra LeoneSingaporeSint Maarten (Dutch part)Slovak RepublicSloveniaSmall statesSolomon IslandsSouth AfricaSouth AsiaSouth Asia (IDA & IBRD)SpainSri LankaSt. Kitts and NevisSt. LuciaSt. Vincent and the GrenadinesSub-Saharan Africa Sub-Saharan Africa (excluding high income)Sub-Saharan Africa (IDA & IBRD countries)SudanSurinameSwazilandSwedenSwitzerlandSyrian Arab RepublicTajikistanTanzaniaThailandTimor-LesteTogoTongaTunisiaTurkeyTurks and Caicos IslandsTuvaluUgandaUkraineUnited Arab EmiratesUnited KingdomUnited StatesUpper middle incomeUruguayVanuatuVenezuela, RBWest Bank and GazaWorldYemen, Rep.Zimbabwe
Zeitlinie:
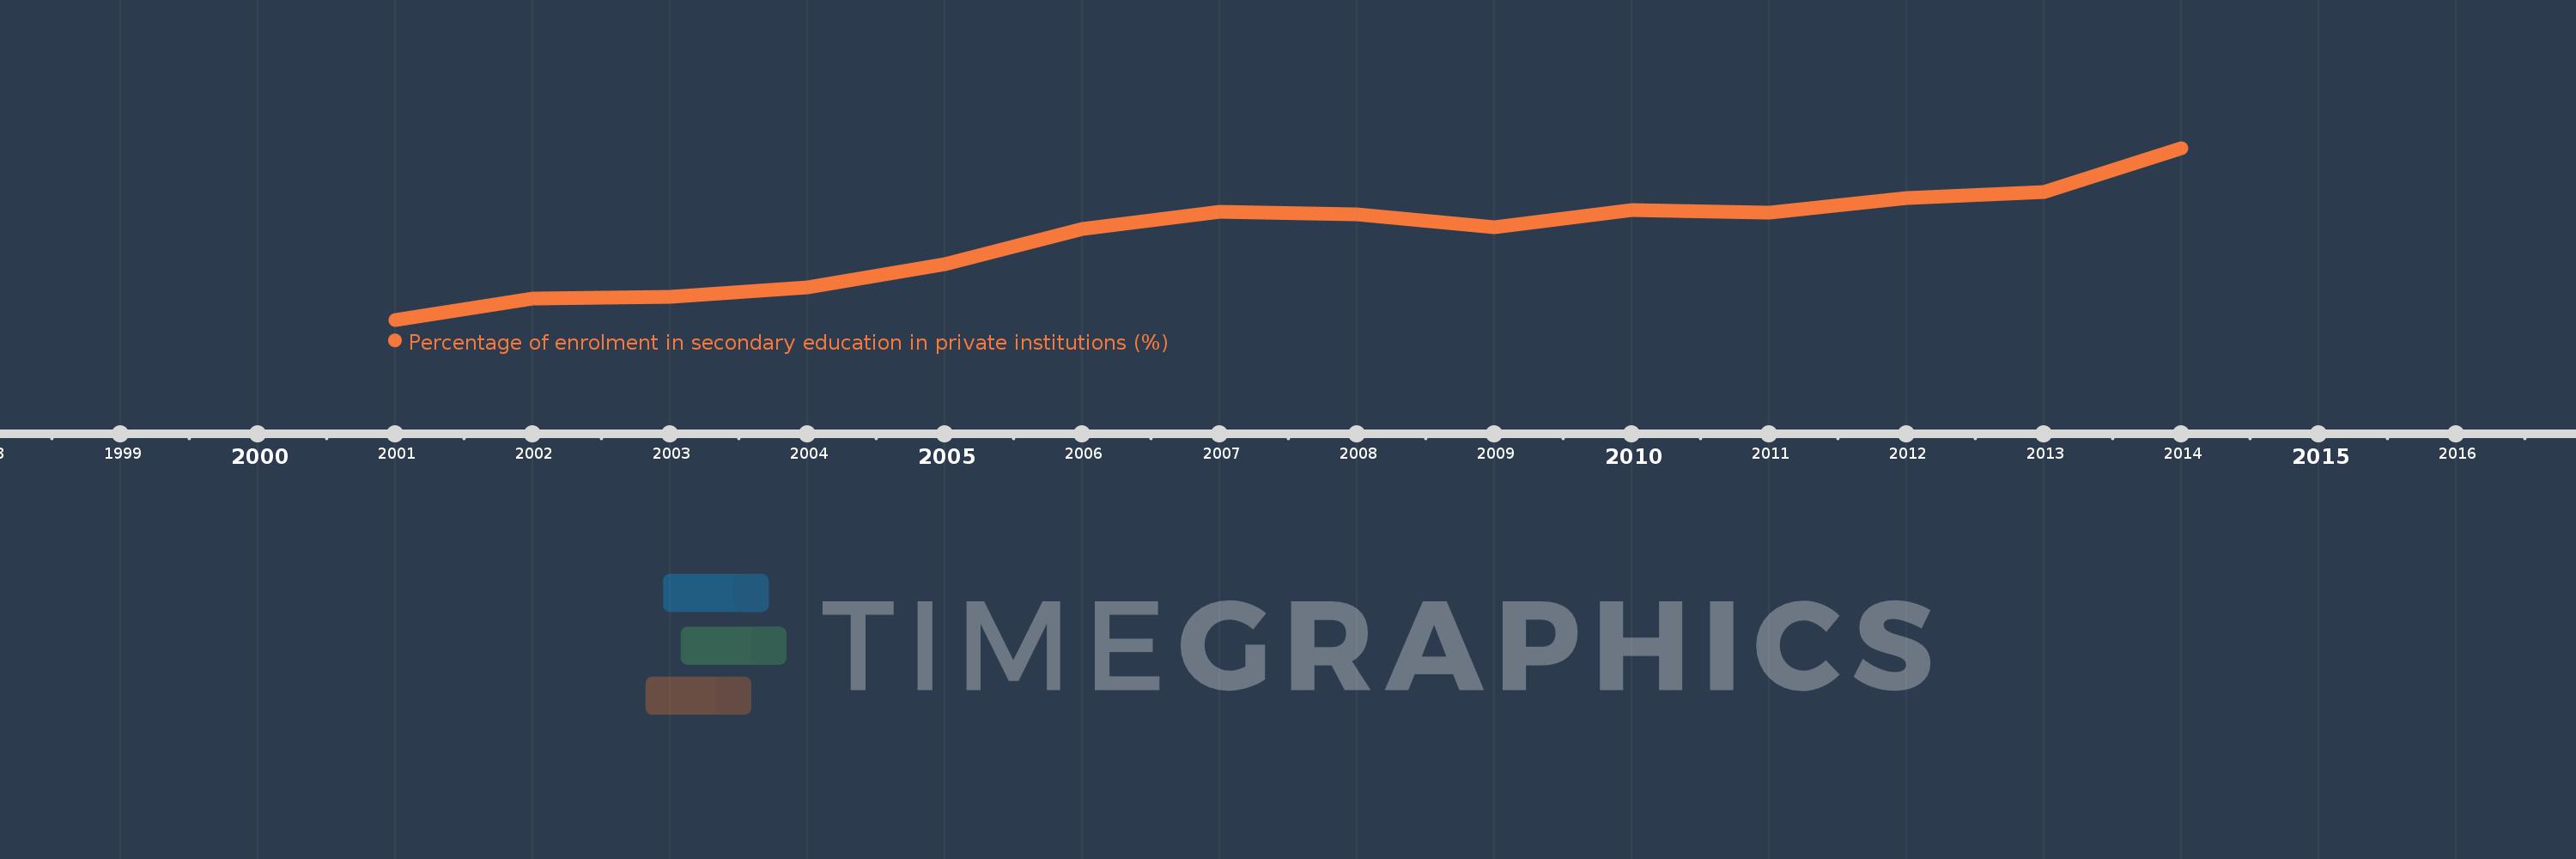
Diese Zeitleiste vorliegt die Graphik ab 2001 J. bis 2014 J. Japan. Die Angaben bis 2000 J. sind nicht vorhanden. Die Zahl aktueller Beobachtungen nach Daten: 14.
Die Quelle (Bezeichnung):
Kennzahlen der Weltentwicklung
Die Quelle (Einrichtung):
UNESCO Institute for Statistics
Kategorien:
Education
Es wurde aktualisiert:
23 Apr 2017 Jahr
Kennzahlen der Wertänderungen vom Jahr zum Jahr
im Durchschnitt:
18.977
Minimum:
18.442
1 Jan 2001 Jahr
Maximum:
19.545
1 Jan 2014 Jahr
Zum Datum der Beobachtung
Wert
Absolute Veränderung
Die Veränderung bezüglich dem vorherigen Wert
1 Jan 2001 Jahr
18.442
+18.442
0.0%
1 Jan 2002 Jahr
18.579
+0.137
0.74%
1 Jan 2003 Jahr
18.587
+0.008
0.04%
1 Jan 2004 Jahr
18.65
+0.063
0.34%
1 Jan 2005 Jahr
18.797
+0.146
0.78%
1 Jan 2006 Jahr
19.027
+0.23
1.22%
1 Jan 2007 Jahr
19.137
+0.11
0.58%
1 Jan 2008 Jahr
19.116
-0.02
-0.11%
1 Jan 2009 Jahr
19.036
-0.08
-0.42%
1 Jan 2010 Jahr
19.146
+0.11
0.58%
1 Jan 2011 Jahr
19.132
-0.014
-0.08%
1 Jan 2012 Jahr
19.225
+0.093
0.49%
1 Jan 2013 Jahr
19.263
+0.038
0.2%
1 Jan 2014 Jahr
19.545
+0.281
1.46%
Bewertung der Länder gemäß mit laufender Statistik nach Jahren

Kommentare:

Abschicken
PremiumAbout & FeedbackVereinbarungPrivatheit
logo
© 2022 Selected Technologies LLC – Morgan Hill, California