30
/de/
AIzaSyAYiBZKx7MnpbEhh9jyipgxe19OcubqV5w
April 1, 2024
80943
Belarus
BLR
true
2
1
Net official flows from UN agencies, UNDP (current US$)
2015,2014,2013,2012,2011,2010,2009,2008,2007,2006,2005,2004,2003,2002,2001,2000,1999,1998,1997,1996,1995,1994
Download
Bibliothek der Globalstatistik →Belarus →

Net official flows from UN agencies, UNDP (current US$)

Diese Statistik in anderen Ländern:

AfghanistanAlbaniaAlgeriaAngolaAntigua and BarbudaArab WorldArgentinaArmeniaArubaAzerbaijanBahamas, TheBahrainBangladeshBarbadosBelarusBelizeBeninBermudaBhutanBoliviaBosnia and HerzegovinaBotswanaBrazilBritish Virgin IslandsBrunei DarussalamBulgariaBurkina FasoBurundiCabo VerdeCambodiaCameroonCaribbean small statesCayman IslandsCentral African RepublicCentral Europe and the BalticsChadChileChinaColombiaComorosCongo, Dem. Rep.Congo, Rep.Costa RicaCote d'IvoireCroatiaCubaCyprusCzech RepublicDjiboutiDominicaDominican RepublicEast Asia & PacificEast Asia & Pacific (excluding high income)East Asia & Pacific (IDA & IBRD countries)EcuadorEgypt, Arab Rep.El SalvadorEquatorial GuineaEritreaEstoniaEthiopiaEuro areaEurope & Central AsiaEurope & Central Asia (excluding high income)Europe & Central Asia (IDA & IBRD countries)European UnionFijiFragile and conflict affected situationsFrench PolynesiaGabonGambia, TheGeorgiaGhanaGibraltarGrenadaGuatemalaGuineaGuinea-BissauGuyanaHaitiHeavily indebted poor countries (HIPC)High incomeHondurasHong Kong SAR, ChinaHungaryIBRD onlyIDA & IBRD totalIDA blendIDA onlyIDA totalIndiaIndonesiaIran, Islamic Rep.IraqIsraelJamaicaJordanKazakhstanKenyaKiribatiKorea, Dem. People’s Rep.Korea, Rep.KosovoKuwaitKyrgyz RepublicLao PDRLatin America & Caribbean Latin America & Caribbean (excluding high income)Latin America & the Caribbean (IDA & IBRD countries)LatviaLeast developed countries: UN classificationLebanonLesothoLiberiaLibyaLithuaniaLow & middle incomeLow incomeLower middle incomeMacao SAR, ChinaMacedonia, FYRMadagascarMalawiMalaysiaMaldivesMaliMaltaMarshall IslandsMauritaniaMauritiusMexicoMicronesia, Fed. Sts.Middle East & North AfricaMiddle East & North Africa (excluding high income)Middle East & North Africa (IDA & IBRD countries)Middle incomeMoldovaMongoliaMontenegroMoroccoMozambiqueMyanmarNamibiaNauruNepalNew CaledoniaNicaraguaNigerNigeriaNorth AmericaNorthern Mariana IslandsOECD membersOmanOther small statesPacific island small statesPakistanPalauPanamaPapua New GuineaParaguayPeruPhilippinesPolandQatarRomaniaRussian FederationRwandaSamoaSao Tome and PrincipeSaudi ArabiaSenegalSerbiaSeychellesSierra LeoneSingaporeSlovak RepublicSloveniaSmall statesSolomon IslandsSomaliaSouth AfricaSouth AsiaSouth Asia (IDA & IBRD)South SudanSri LankaSt. Kitts and NevisSt. LuciaSt. Vincent and the GrenadinesSub-Saharan Africa Sub-Saharan Africa (excluding high income)Sub-Saharan Africa (IDA & IBRD countries)SudanSurinameSwazilandSyrian Arab RepublicTajikistanTanzaniaThailandTimor-LesteTogoTongaTrinidad and TobagoTunisiaTurkeyTurkmenistanTurks and Caicos IslandsTuvaluUgandaUkraineUnited Arab EmiratesUpper middle incomeUruguayUzbekistanVanuatuVenezuela, RBVietnamWest Bank and GazaWorldYemen, Rep.ZambiaZimbabwe

Zeitlinie:

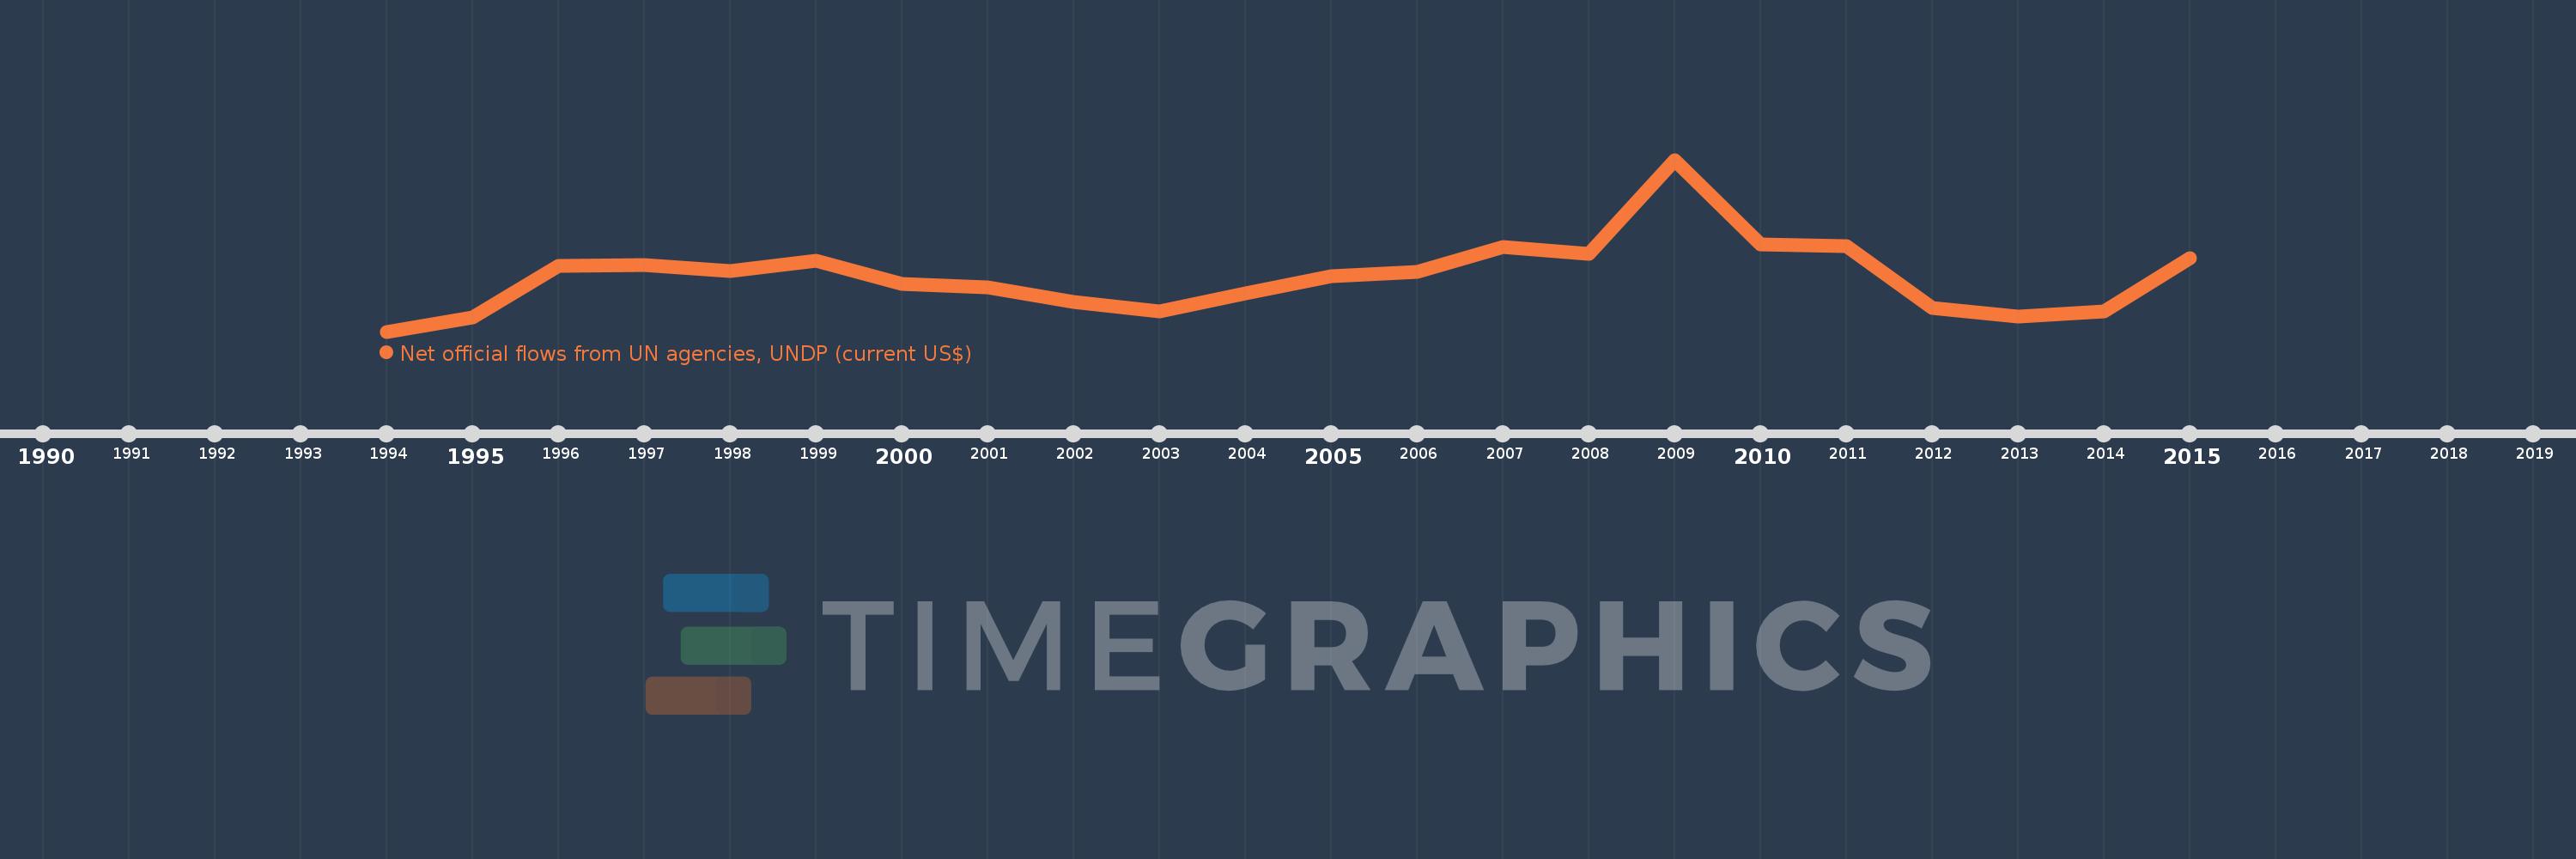
Diese Zeitleiste vorliegt die Graphik ab 1994 J. bis 2015 J. Belarus. Die Angaben bis 1993 J. sind nicht vorhanden. Die Zahl aktueller Beobachtungen nach Daten: 22.

Die Quelle (Bezeichnung):

Kennzahlen der Weltentwicklung

Die Quelle (Einrichtung):

Development Assistance Committee of the Organisation for Economic Co-operation and Development, Geographical Distribution of Financial Flows to Developing Countries, Development Co-operation Report, and International Development Statistics database. Data are available online at: www.oecd.org/dac/stats/idsonline.

Kategorien:

Aid Effectiveness

Es wurde aktualisiert:

23 Apr 2017 Jahr

Kennzahlen der Wertänderungen vom Jahr zum Jahr

im Durchschnitt:
549.091 Tsnd.
Minimum:
30.0 Tsnd.
1 Jan 1994 Jahr
Maximum:
1.65 Mln.
1 Jan 2009 Jahr
Zum Datum der Beobachtung
Wert
Absolute Veränderung
Die Veränderung bezüglich dem vorherigen Wert
1 Jan 1994 Jahr
30.0 Tsnd.
+30.0 Tsnd.
0.0%
1 Jan 1995 Jahr
160.0 Tsnd.
+130.0 Tsnd.
433.33%
1 Jan 1996 Jahr
650.0 Tsnd.
+490.0 Tsnd.
306.25%
1 Jan 1997 Jahr
660.0 Tsnd.
+10.0 Tsnd.
1.54%
1 Jan 1998 Jahr
600.0 Tsnd.
-60.0 Tsnd.
-9.09%
1 Jan 1999 Jahr
700.0 Tsnd.
+100.0 Tsnd.
16.67%
1 Jan 2000 Jahr
480.0 Tsnd.
-220.0 Tsnd.
-31.43%
1 Jan 2001 Jahr
450.0 Tsnd.
-30.0 Tsnd.
-6.25%
1 Jan 2002 Jahr
310.0 Tsnd.
-140.0 Tsnd.
-31.11%
1 Jan 2003 Jahr
220.0 Tsnd.
-90.0 Tsnd.
-29.03%
1 Jan 2004 Jahr
390.0 Tsnd.
+170.0 Tsnd.
77.27%
1 Jan 2005 Jahr
550.0 Tsnd.
+160.0 Tsnd.
41.03%
1 Jan 2006 Jahr
590.0 Tsnd.
+40.0 Tsnd.
7.27%
1 Jan 2007 Jahr
830.0 Tsnd.
+240.0 Tsnd.
40.68%
1 Jan 2008 Jahr
760.0 Tsnd.
-70.0 Tsnd.
-8.43%
1 Jan 2009 Jahr
1.65 Mln.
+890.0 Tsnd.
117.11%
1 Jan 2010 Jahr
850.0 Tsnd.
-800.0 Tsnd.
-48.48%
1 Jan 2011 Jahr
840.0 Tsnd.
-10.0 Tsnd.
-1.18%
1 Jan 2012 Jahr
250.0 Tsnd.
-590.0 Tsnd.
-70.24%
1 Jan 2013 Jahr
170.0 Tsnd.
-80.0 Tsnd.
-32.0%
1 Jan 2014 Jahr
220.0 Tsnd.
+50.0 Tsnd.
29.41%
1 Jan 2015 Jahr
720.0 Tsnd.
+500.0 Tsnd.
227.27%

Bewertung der Länder gemäß mit laufender Statistik nach Jahren