33
/de/
AIzaSyAYiBZKx7MnpbEhh9jyipgxe19OcubqV5w
August 1, 2025
184276
Macedonia, FYR
MKD
true
2
1
Net official flows from UN agencies, UNDP (current US$)
2015,2014,2013,2012,2011,2010,2009,2008,2007,2006,2005,2004,2003,2002,2001,2000,1999,1998,1997,1996
Download
Bibliothek der Globalstatistik →Macedonia, FYR →

Net official flows from UN agencies, UNDP (current US$)

Diese Statistik in anderen Ländern:

AfghanistanAlbaniaAlgeriaAngolaAntigua and BarbudaArab WorldArgentinaArmeniaArubaAzerbaijanBahamas, TheBahrainBangladeshBarbadosBelarusBelizeBeninBermudaBhutanBoliviaBosnia and HerzegovinaBotswanaBrazilBritish Virgin IslandsBrunei DarussalamBulgariaBurkina FasoBurundiCabo VerdeCambodiaCameroonCaribbean small statesCayman IslandsCentral African RepublicCentral Europe and the BalticsChadChileChinaColombiaComorosCongo, Dem. Rep.Congo, Rep.Costa RicaCote d'IvoireCroatiaCubaCyprusCzech RepublicDjiboutiDominicaDominican RepublicEast Asia & PacificEast Asia & Pacific (excluding high income)East Asia & Pacific (IDA & IBRD countries)EcuadorEgypt, Arab Rep.El SalvadorEquatorial GuineaEritreaEstoniaEthiopiaEuro areaEurope & Central AsiaEurope & Central Asia (excluding high income)Europe & Central Asia (IDA & IBRD countries)European UnionFijiFragile and conflict affected situationsFrench PolynesiaGabonGambia, TheGeorgiaGhanaGibraltarGrenadaGuatemalaGuineaGuinea-BissauGuyanaHaitiHeavily indebted poor countries (HIPC)High incomeHondurasHong Kong SAR, ChinaHungaryIBRD onlyIDA & IBRD totalIDA blendIDA onlyIDA totalIndiaIndonesiaIran, Islamic Rep.IraqIsraelJamaicaJordanKazakhstanKenyaKiribatiKorea, Dem. People’s Rep.Korea, Rep.KosovoKuwaitKyrgyz RepublicLao PDRLatin America & Caribbean Latin America & Caribbean (excluding high income)Latin America & the Caribbean (IDA & IBRD countries)LatviaLeast developed countries: UN classificationLebanonLesothoLiberiaLibyaLithuaniaLow & middle incomeLow incomeLower middle incomeMacao SAR, ChinaMacedonia, FYRMadagascarMalawiMalaysiaMaldivesMaliMaltaMarshall IslandsMauritaniaMauritiusMexicoMicronesia, Fed. Sts.Middle East & North AfricaMiddle East & North Africa (excluding high income)Middle East & North Africa (IDA & IBRD countries)Middle incomeMoldovaMongoliaMontenegroMoroccoMozambiqueMyanmarNamibiaNauruNepalNew CaledoniaNicaraguaNigerNigeriaNorth AmericaNorthern Mariana IslandsOECD membersOmanOther small statesPacific island small statesPakistanPalauPanamaPapua New GuineaParaguayPeruPhilippinesPolandQatarRomaniaRussian FederationRwandaSamoaSao Tome and PrincipeSaudi ArabiaSenegalSerbiaSeychellesSierra LeoneSingaporeSlovak RepublicSloveniaSmall statesSolomon IslandsSomaliaSouth AfricaSouth AsiaSouth Asia (IDA & IBRD)South SudanSri LankaSt. Kitts and NevisSt. LuciaSt. Vincent and the GrenadinesSub-Saharan Africa Sub-Saharan Africa (excluding high income)Sub-Saharan Africa (IDA & IBRD countries)SudanSurinameSwazilandSyrian Arab RepublicTajikistanTanzaniaThailandTimor-LesteTogoTongaTrinidad and TobagoTunisiaTurkeyTurkmenistanTurks and Caicos IslandsTuvaluUgandaUkraineUnited Arab EmiratesUpper middle incomeUruguayUzbekistanVanuatuVenezuela, RBVietnamWest Bank and GazaWorldYemen, Rep.ZambiaZimbabwe

Zeitlinie:

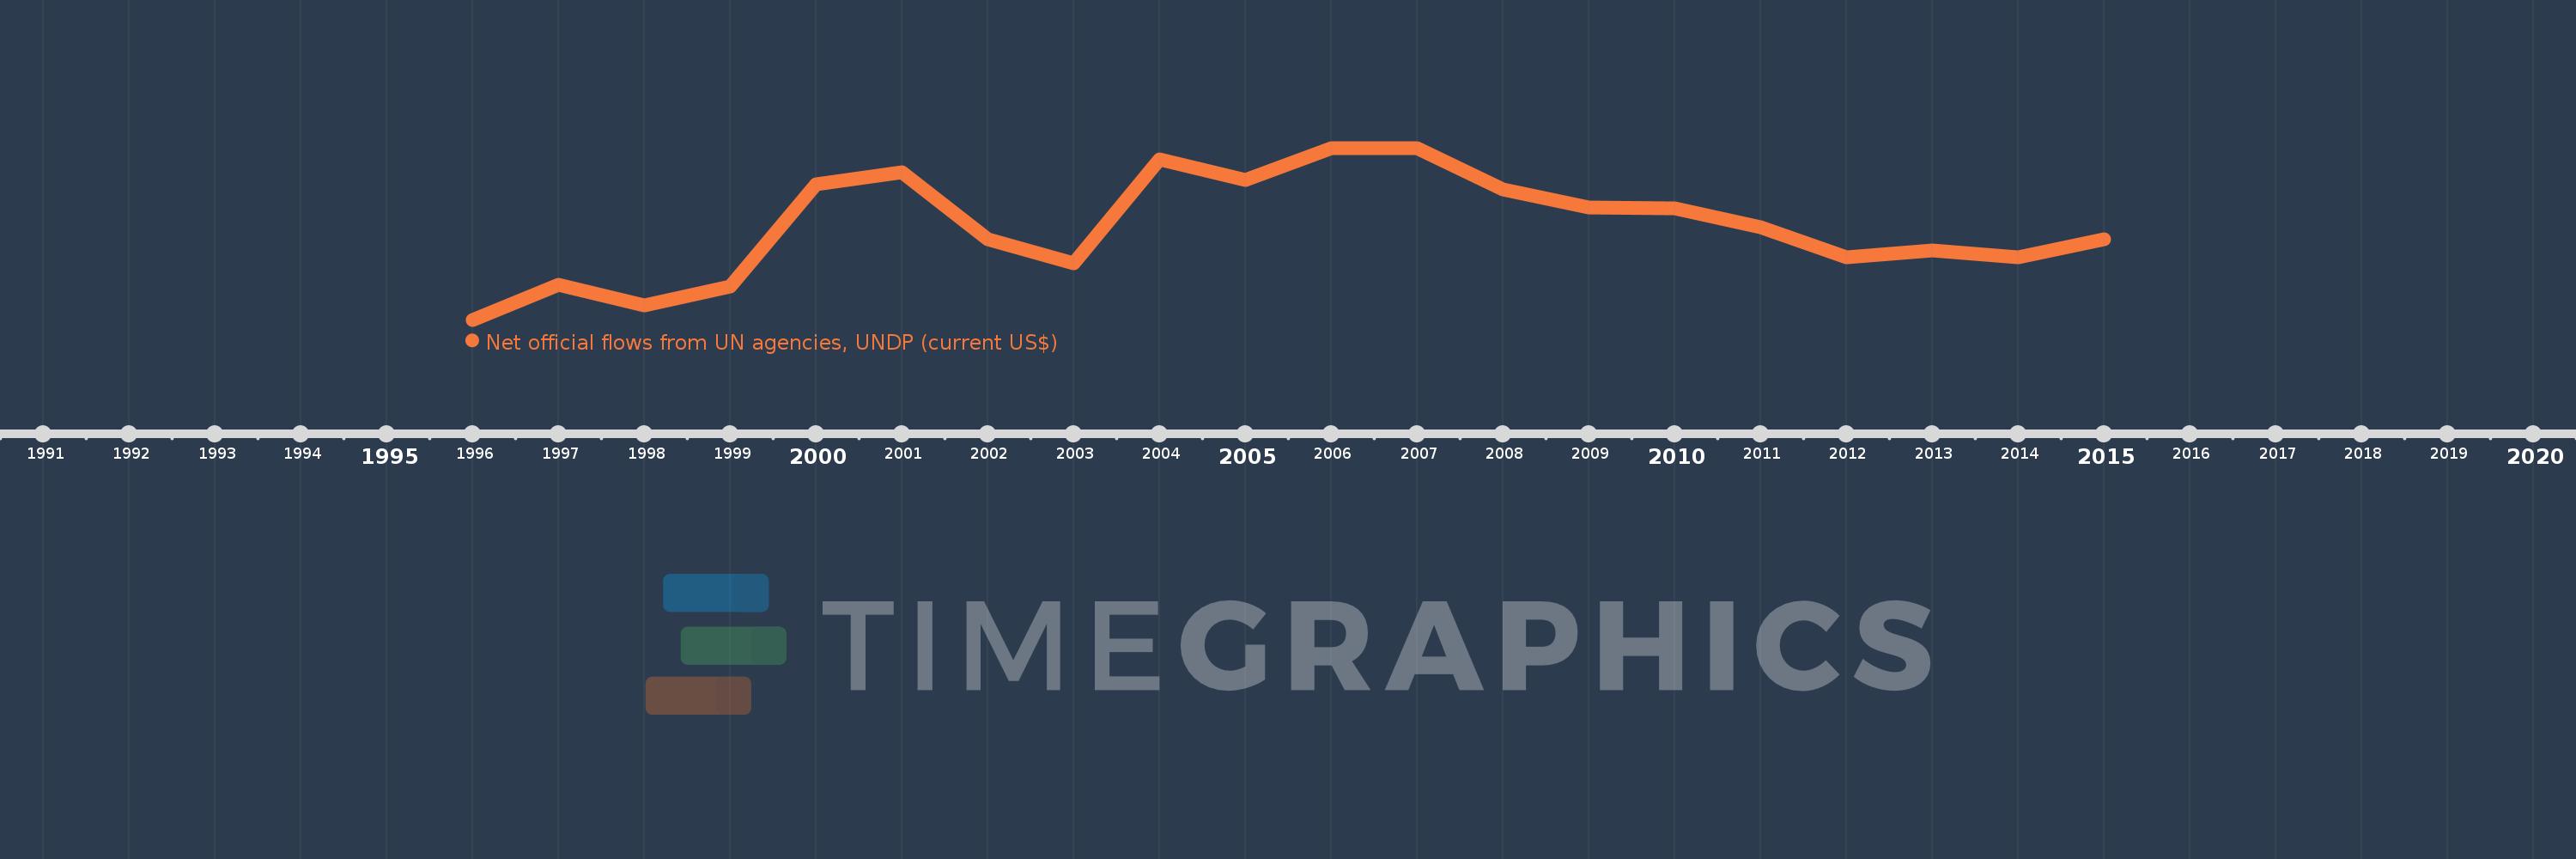
Diese Zeitleiste vorliegt die Graphik ab 1996 J. bis 2015 J. Macedonia, FYR. Die Angaben bis 1995 J. sind nicht vorhanden. Die Zahl aktueller Beobachtungen nach Daten: 20.

Die Quelle (Bezeichnung):

Kennzahlen der Weltentwicklung

Die Quelle (Einrichtung):

Development Assistance Committee of the Organisation for Economic Co-operation and Development, Geographical Distribution of Financial Flows to Developing Countries, Development Co-operation Report, and International Development Statistics database. Data are available online at: www.oecd.org/dac/stats/idsonline.

Kategorien:

Aid Effectiveness

Es wurde aktualisiert:

23 Apr 2017 Jahr

Kennzahlen der Wertänderungen vom Jahr zum Jahr

im Durchschnitt:
696.5 Tsnd.
Minimum:
50.0 Tsnd.
1 Jan 1996 Jahr
Maximum:
1.24 Mln.
1 Jan 2006 Jahr
Zum Datum der Beobachtung
Wert
Absolute Veränderung
Die Veränderung bezüglich dem vorherigen Wert
1 Jan 1996 Jahr
50.0 Tsnd.
+50.0 Tsnd.
0.0%
1 Jan 1997 Jahr
290.0 Tsnd.
+240.0 Tsnd.
480.0%
1 Jan 1998 Jahr
150.0 Tsnd.
-140.0 Tsnd.
-48.28%
1 Jan 1999 Jahr
280.0 Tsnd.
+130.0 Tsnd.
86.67%
1 Jan 2000 Jahr
990.0 Tsnd.
+710.0 Tsnd.
253.57%
1 Jan 2001 Jahr
1.07 Mln.
+80.0 Tsnd.
8.08%
1 Jan 2002 Jahr
610.0 Tsnd.
-460.0 Tsnd.
-42.99%
1 Jan 2003 Jahr
440.0 Tsnd.
-170.0 Tsnd.
-27.87%
1 Jan 2004 Jahr
1.16 Mln.
+720.0 Tsnd.
163.64%
1 Jan 2005 Jahr
1.02 Mln.
-140.0 Tsnd.
-12.07%
1 Jan 2006 Jahr
1.24 Mln.
+220.0 Tsnd.
21.57%
1 Jan 2007 Jahr
1.24 Mln.
0.0
0.0%
1 Jan 2008 Jahr
950.0 Tsnd.
-290.0 Tsnd.
-23.39%
1 Jan 2009 Jahr
830.0 Tsnd.
-120.0 Tsnd.
-12.63%
1 Jan 2010 Jahr
820.0 Tsnd.
-10.0 Tsnd.
-1.2%
1 Jan 2011 Jahr
690.0 Tsnd.
-130.0 Tsnd.
-15.85%
1 Jan 2012 Jahr
480.0 Tsnd.
-210.0 Tsnd.
-30.43%
1 Jan 2013 Jahr
530.0 Tsnd.
+50.0 Tsnd.
10.42%
1 Jan 2014 Jahr
480.0 Tsnd.
-50.0 Tsnd.
-9.43%
1 Jan 2015 Jahr
610.0 Tsnd.
+130.0 Tsnd.
27.08%

Bewertung der Länder gemäß mit laufender Statistik nach Jahren