33
/de/
AIzaSyB4mHJ5NPEv-XzF7P6NDYXjlkCWaeKw5bc
November 30, 2025
78280
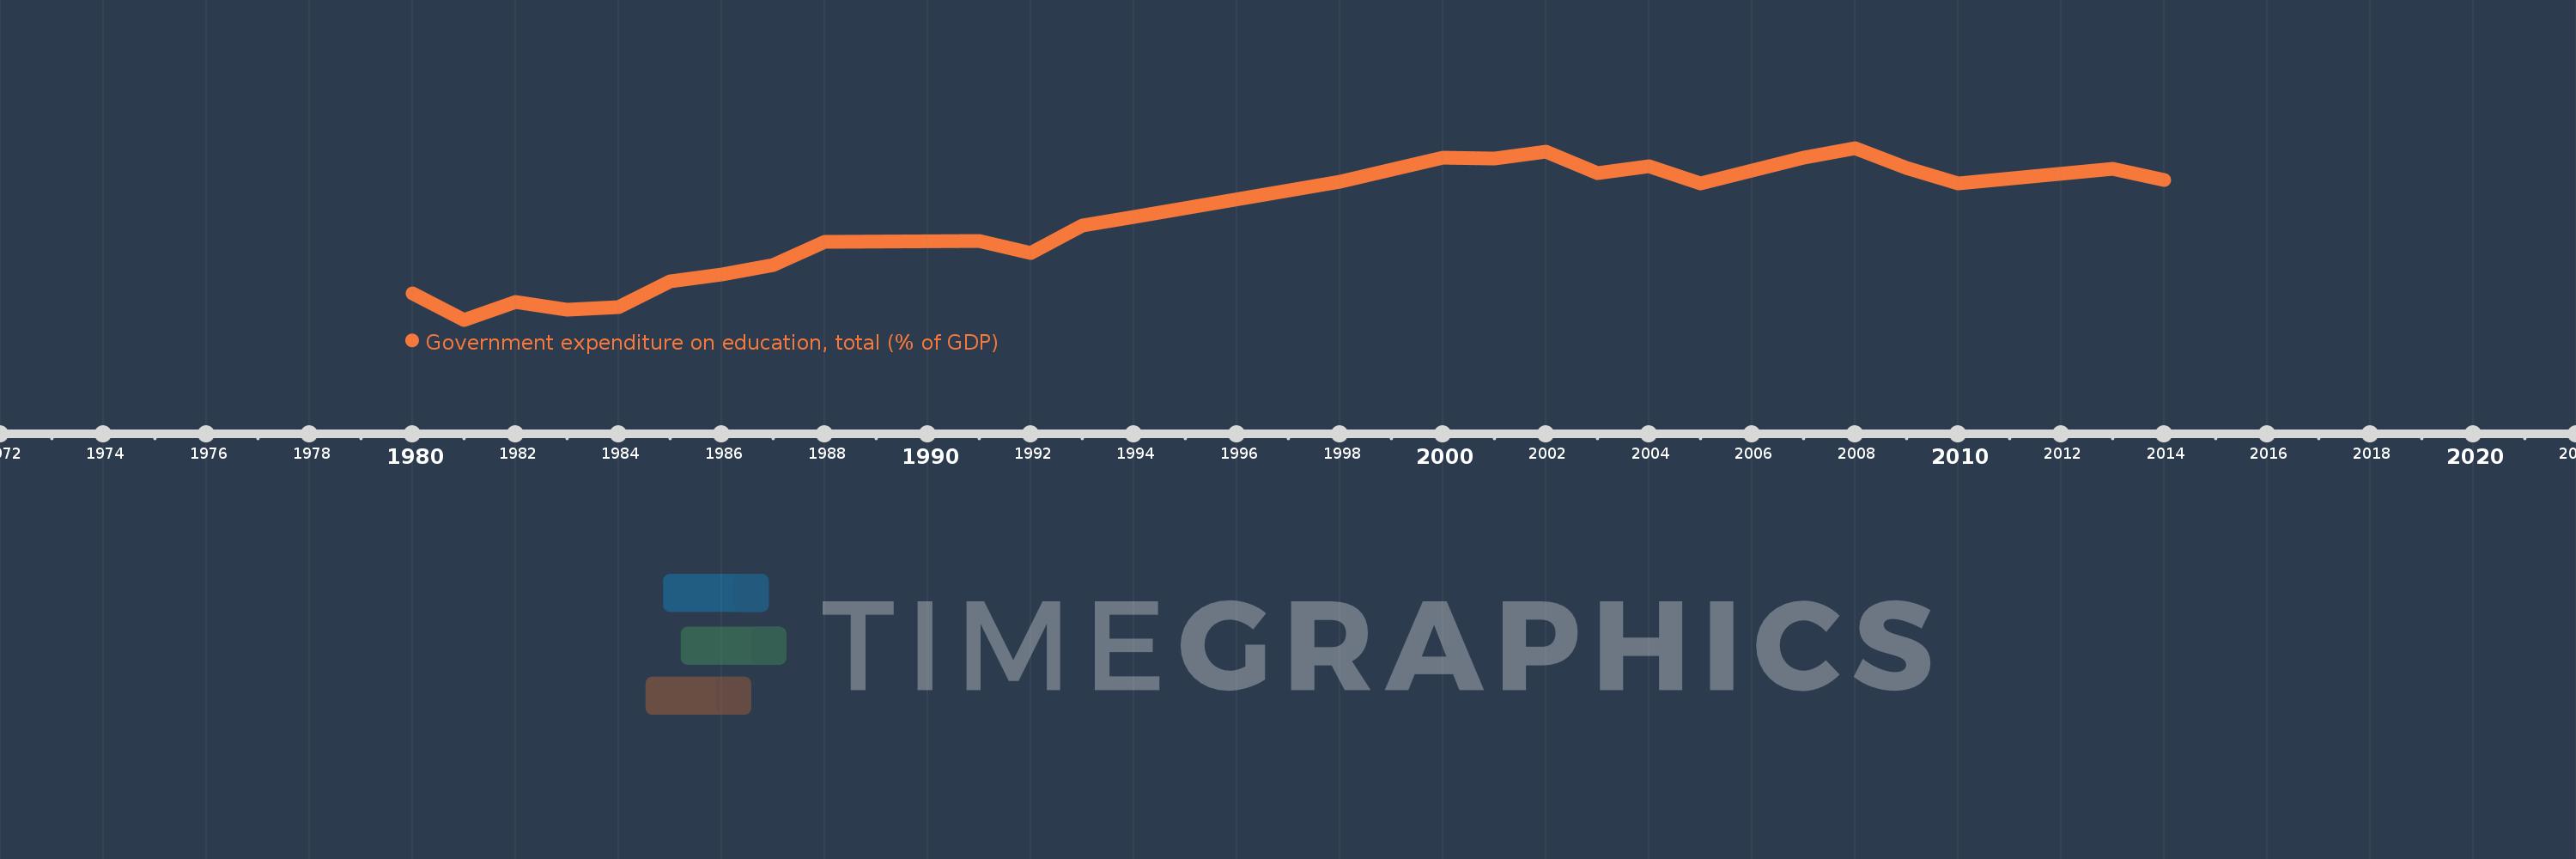
Bangladesh
BGD
true
2
1
Government expenditure on education, total (% of GDP)
2014,2013,2010,2009,2008,2007,2005,2004,2003,2002,2001,2000,1998,1994,1993,1992,1991,1988,1987,1986,1985,1984,1983,1982,1981,1980