33
/de/
AIzaSyB4mHJ5NPEv-XzF7P6NDYXjlkCWaeKw5bc
November 30, 2025
141844
Greece
GRC
true
2
1
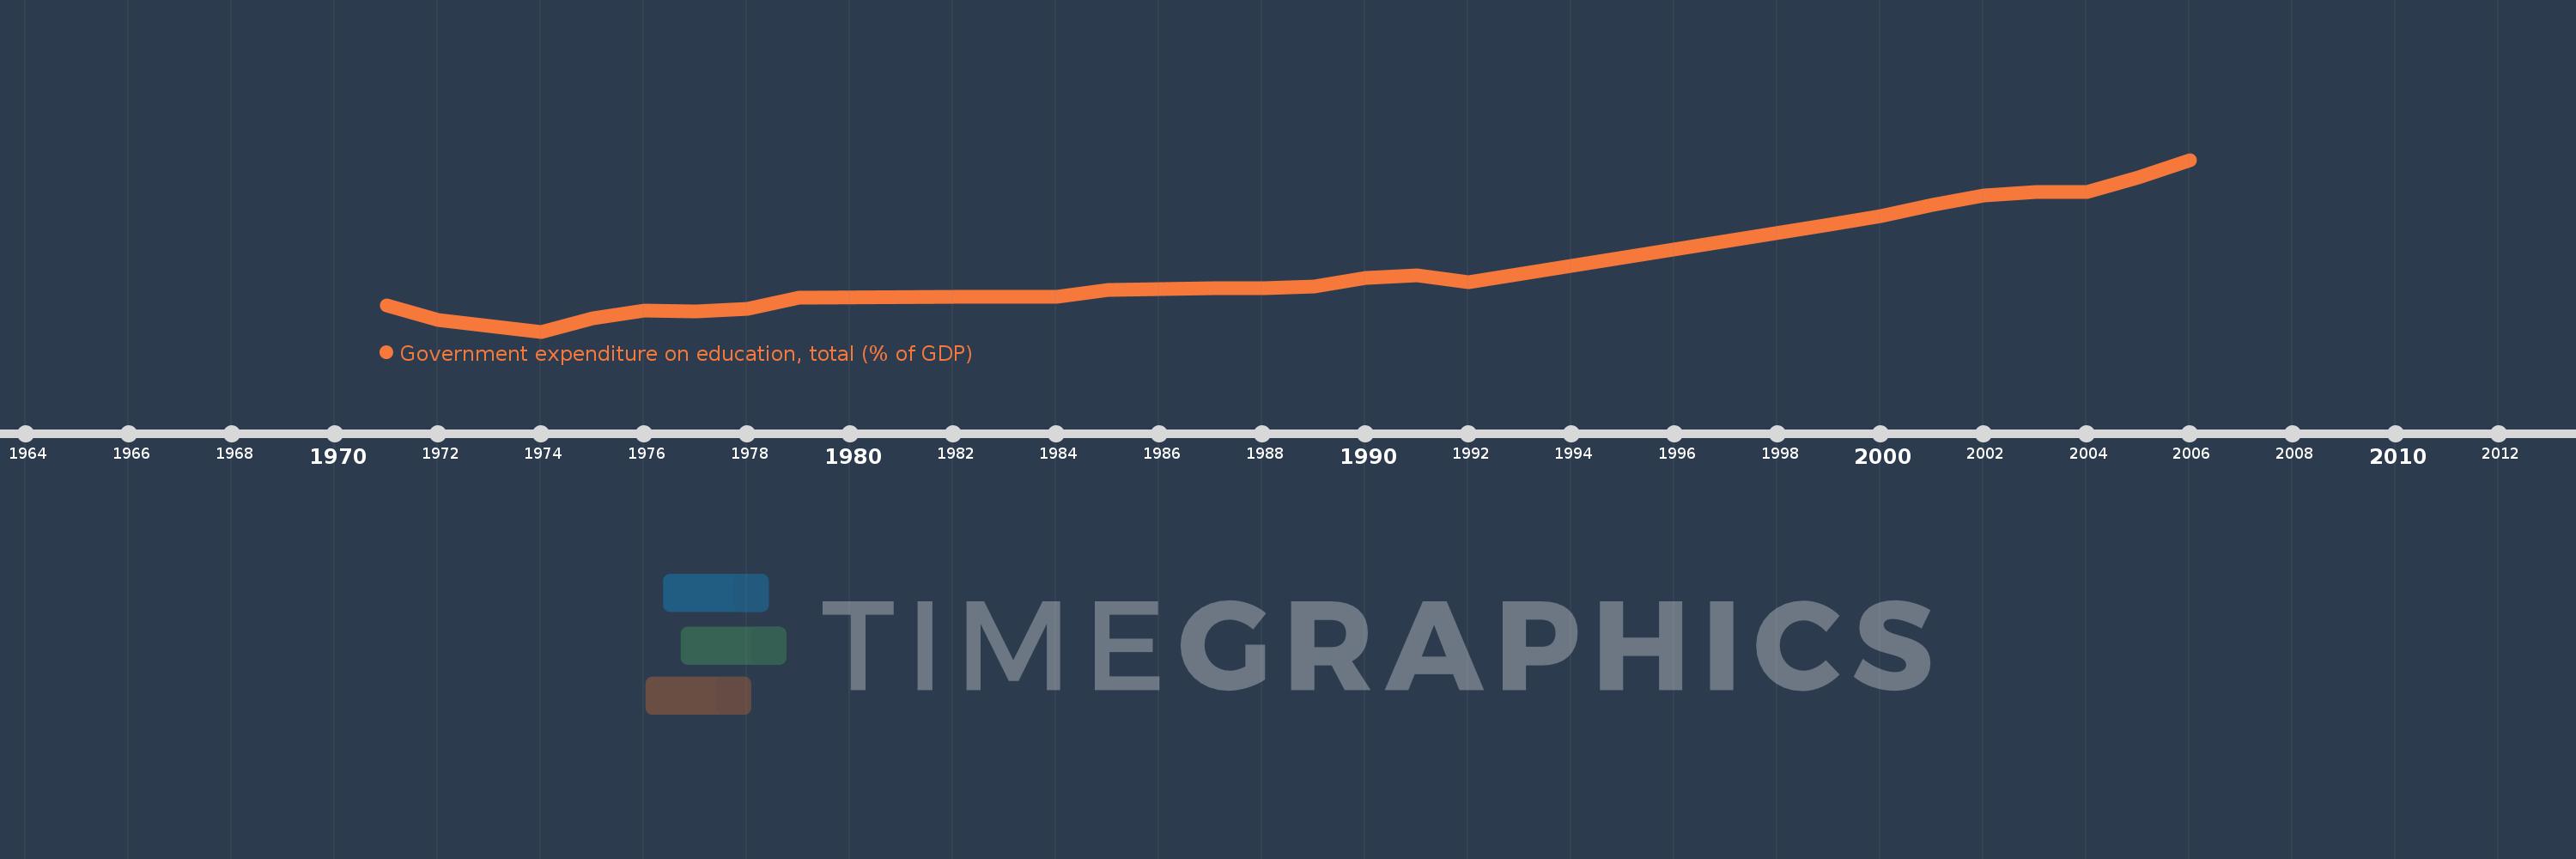
Government expenditure on education, total (% of GDP)
2006,2005,2004,2003,2002,2001,2000,1999,1992,1991,1990,1989,1988,1987,1985,1984,1983,1982,1979,1978,1977,1976,1975,1974,1972,1971