33
/de/
AIzaSyB4mHJ5NPEv-XzF7P6NDYXjlkCWaeKw5bc
November 30, 2025
60465
Sub-Saharan Africa (excluding high income)
SSA
false
2
1
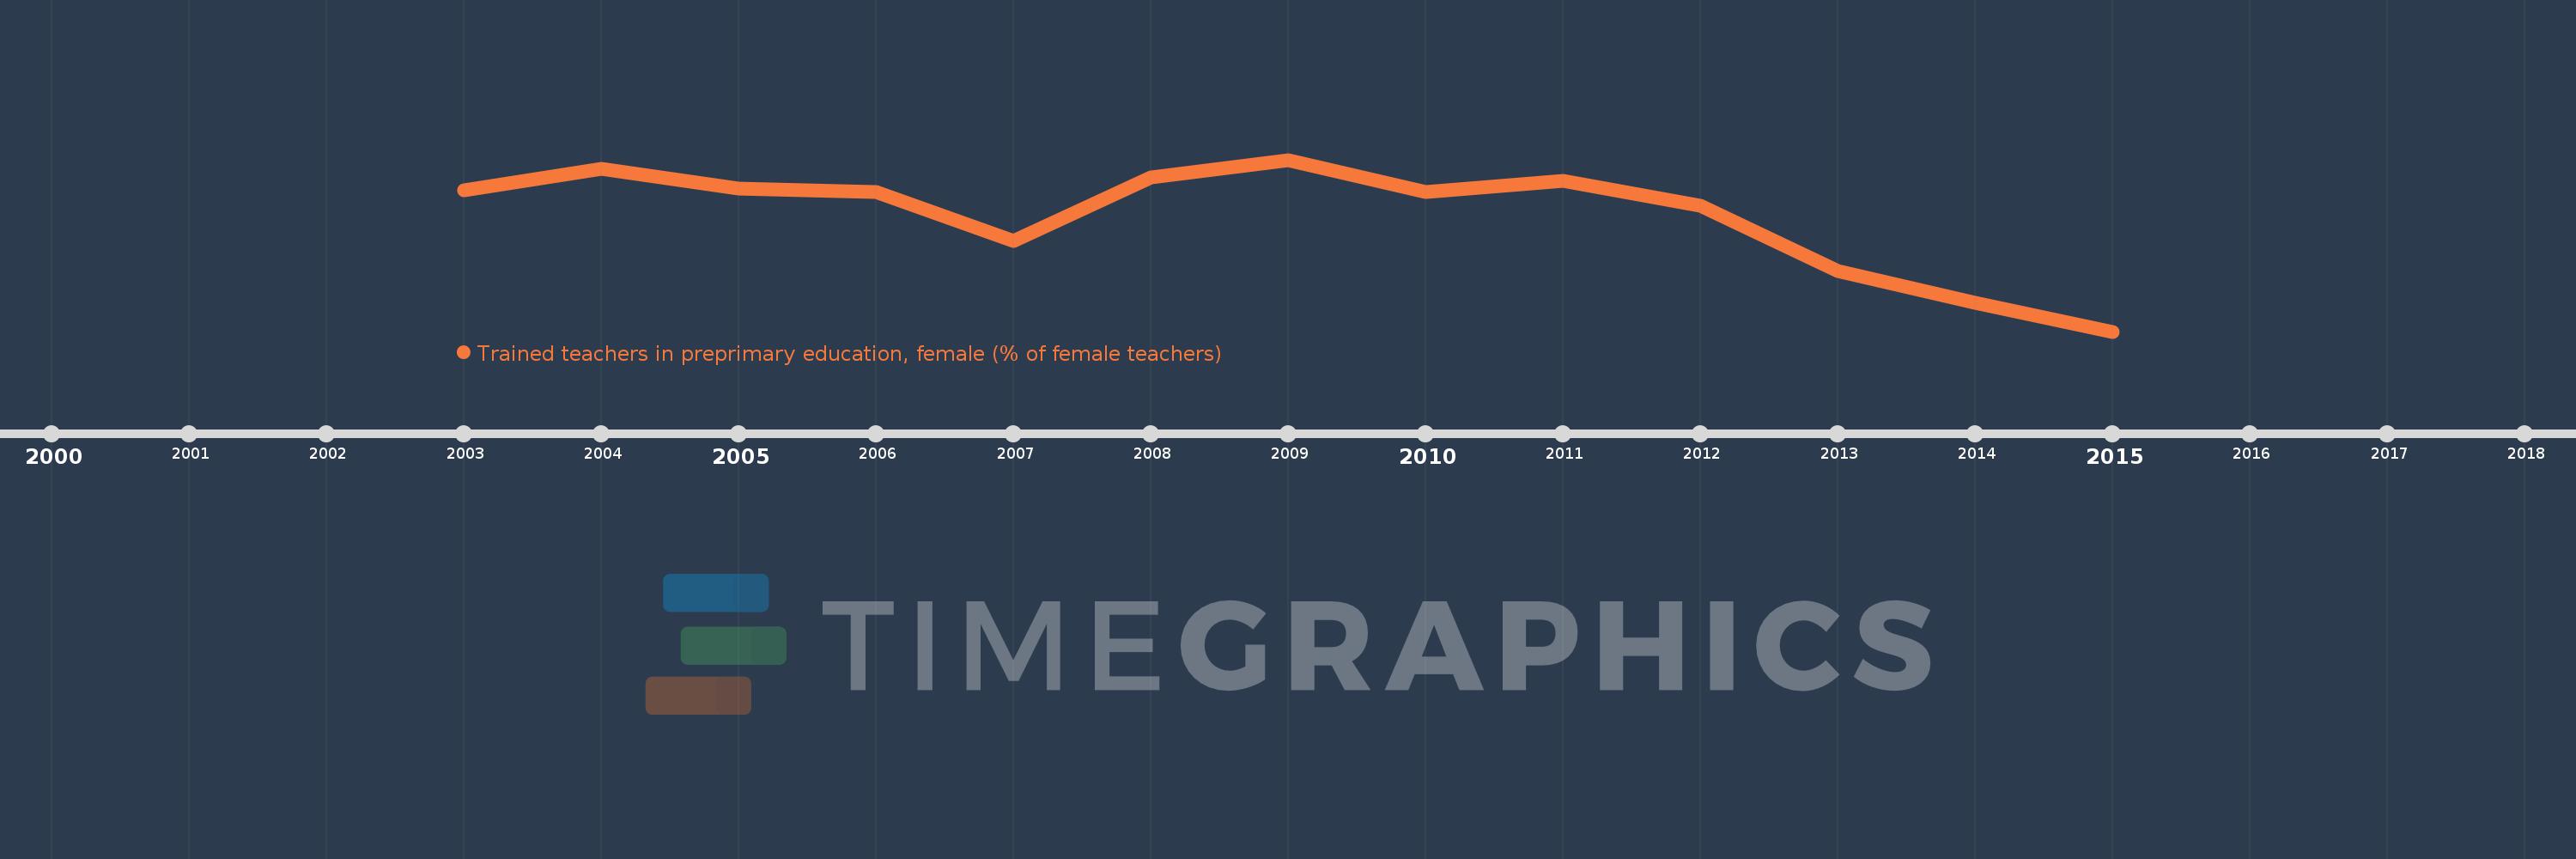
Trained teachers in preprimary education, female (% of female teachers)
2015,2014,2013,2012,2011,2010,2009,2008,2007,2006,2005,2004,2003