33
/de/
AIzaSyAYiBZKx7MnpbEhh9jyipgxe19OcubqV5w
August 1, 2025
189730
Maldives
MDV
true
2
1
Trained teachers in preprimary education, female (% of female teachers)
2015,2014,2013,2012,2011,2010,2007,2006,2004,2003,2002,2001,2000,1999
Download
Bibliothek der Globalstatistik →Maldives →

Trained teachers in preprimary education, female (% of female teachers)

Diese Statistik in anderen Ländern:

AndorraAngolaAntigua and BarbudaArab WorldArmeniaArubaAzerbaijanBahamas, TheBahrainBarbadosBelarusBelizeBeninBermudaBhutanBoliviaBotswanaBritish Virgin IslandsBrunei DarussalamBurkina FasoBurundiCabo VerdeCambodiaCameroonCaribbean small statesCayman IslandsChadColombiaCongo, Dem. Rep.Congo, Rep.Costa RicaCote d'IvoireCroatiaCubaDjiboutiDominicaDominican RepublicEcuadorEgypt, Arab Rep.El SalvadorEritreaEthiopiaFragile and conflict affected situationsGambia, TheGeorgiaGhanaGibraltarGrenadaGuineaGuinea-BissauGuyanaHeavily indebted poor countries (HIPC)HondurasIDA blendIDA onlyIDA totalIraqKazakhstanKenyaKuwaitKyrgyz RepublicLao PDRLeast developed countries: UN classificationLebanonLiberiaLow incomeMacao SAR, ChinaMadagascarMalaysiaMaldivesMaliMarshall IslandsMauritaniaMauritiusMiddle East & North AfricaMiddle East & North Africa (excluding high income)Middle East & North Africa (IDA & IBRD countries)MoldovaMongoliaMoroccoMyanmarNamibiaNauruNepalNicaraguaNigerOmanOther small statesPacific island small statesPanamaParaguayPre-demographic dividendQatarRwandaSamoaSao Tome and PrincipeSaudi ArabiaSenegalSerbiaSeychellesSierra LeoneSmall statesSolomon IslandsSouth AfricaSouth SudanSt. Kitts and NevisSt. LuciaSt. Vincent and the GrenadinesSub-Saharan Africa Sub-Saharan Africa (excluding high income)Sub-Saharan Africa (IDA & IBRD countries)SurinameSwazilandSyrian Arab RepublicTajikistanTanzaniaTogoTongaTrinidad and TobagoTuvaluUnited Arab EmiratesUzbekistanVietnamWest Bank and GazaZimbabwe

Zeitlinie:

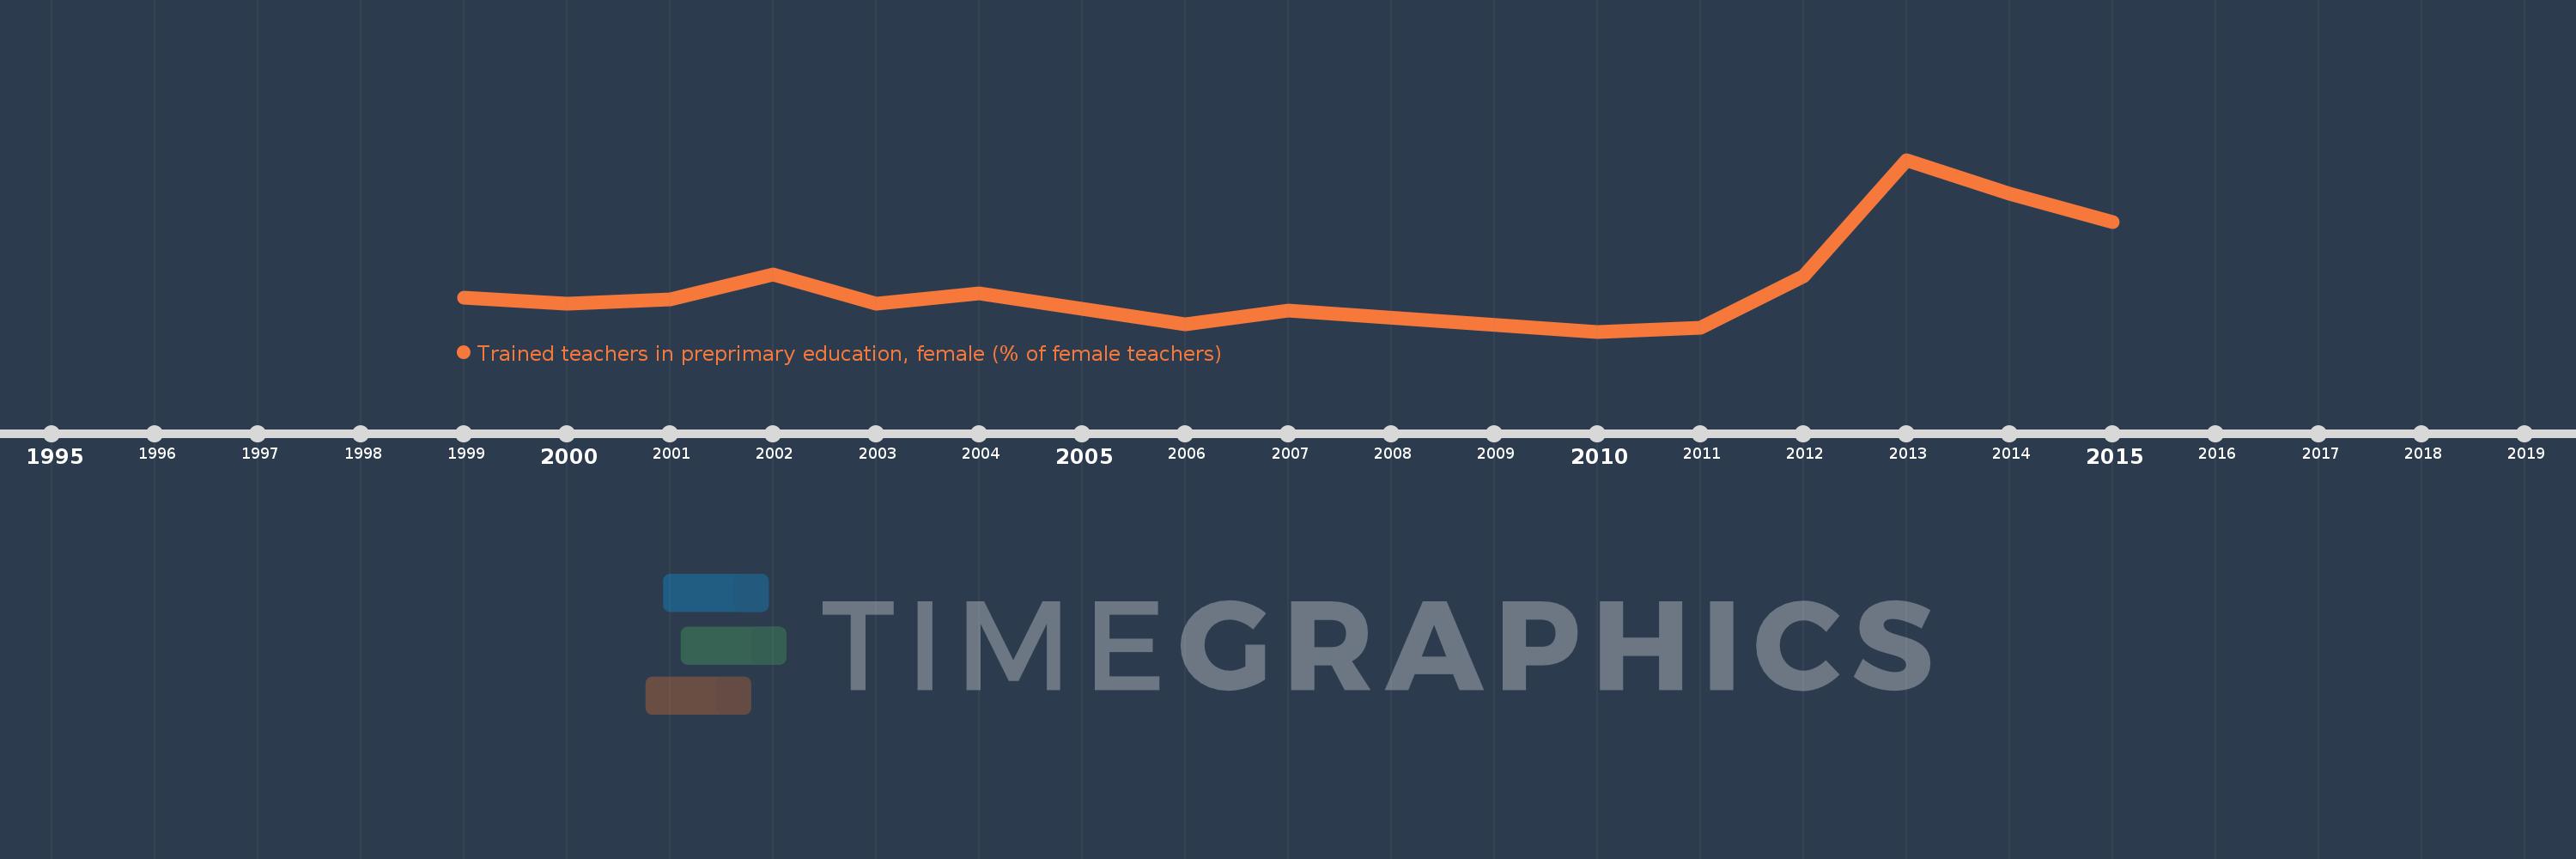
Diese Zeitleiste vorliegt die Graphik ab 1999 J. bis 2015 J. Maldives. Die Angaben bis 1998 J. sind nicht vorhanden. Die Zahl aktueller Beobachtungen nach Daten: 14.

Die Quelle (Bezeichnung):

Kennzahlen der Weltentwicklung

Die Quelle (Einrichtung):

United Nations Educational, Scientific, and Cultural Organization (UNESCO) Institute for Statistics.

Kategorien:

Education

Es wurde aktualisiert:

23 Apr 2017 Jahr

Kennzahlen der Wertänderungen vom Jahr zum Jahr

im Durchschnitt:
54.827
Minimum:
38.396
1 Jan 2010 Jahr
Maximum:
92.927
1 Jan 2013 Jahr
Zum Datum der Beobachtung
Wert
Absolute Veränderung
Die Veränderung bezüglich dem vorherigen Wert
1 Jan 1999 Jahr
49.221
+49.221
0.0%
1 Jan 2000 Jahr
47.159
-2.062
-4.19%
1 Jan 2001 Jahr
48.705
+1.546
3.28%
1 Jan 2002 Jahr
56.654
+7.949
16.32%
1 Jan 2003 Jahr
47.217
-9.437
-16.66%
1 Jan 2004 Jahr
50.524
+3.307
7.0%
1 Jan 2006 Jahr
40.816
-9.708
-19.21%
1 Jan 2007 Jahr
44.983
+4.167
10.21%
1 Jan 2010 Jahr
38.396
-6.587
-14.64%
1 Jan 2011 Jahr
39.579
+1.183
3.08%
1 Jan 2012 Jahr
55.892
+16.313
41.22%
1 Jan 2013 Jahr
92.927
+37.035
66.26%
1 Jan 2014 Jahr
82.26
-10.667
-11.48%
1 Jan 2015 Jahr
73.251
-9.009
-10.95%

Bewertung der Länder gemäß mit laufender Statistik nach Jahren