29
/de/
de
AIzaSyAYiBZKx7MnpbEhh9jyipgxe19OcubqV5w
April 1, 2024
57781
South Asia
SAS
false
2
1
Unemployment with tertiary education, male (% of male unemployment)
2011,2006,2005,2004,2003,2002,2001,2000,1999,1998,1997,1996,1995,1994,1993,1992
Download
Bibliothek der Globalstatistik →South Asia →

Unemployment with tertiary education, male (% of male unemployment)

Diese Statistik in anderen Ländern:
AlbaniaAlgeriaArgentinaArmeniaArubaAustraliaAustriaAzerbaijanBahamas, TheBahrainBangladeshBarbadosBelarusBelgiumBelizeBermudaBhutanBoliviaBosnia and HerzegovinaBotswanaBrazilBritish Virgin IslandsBrunei DarussalamBulgariaBurkina FasoCanadaCaribbean small statesCayman IslandsCentral African RepublicCentral Europe and the BalticsChileColombiaCosta RicaCroatiaCubaCyprusCzech RepublicDenmarkDominicaDominican RepublicEarly-demographic dividendEcuadorEgypt, Arab Rep.El SalvadorEstoniaEthiopiaEuro areaEurope & Central AsiaEurope & Central Asia (excluding high income)Europe & Central Asia (IDA & IBRD countries)European UnionFijiFinlandFranceGabonGeorgiaGermanyGreeceGuatemalaHigh incomeHondurasHong Kong SAR, ChinaHungaryIcelandIndiaIndonesiaIran, Islamic Rep.IrelandIsraelItalyJamaicaJapanJordanKazakhstanKorea, Rep.KosovoKuwaitKyrgyz RepublicLatin America & Caribbean Latin America & Caribbean (excluding high income)Latin America & the Caribbean (IDA & IBRD countries)LatviaLebanonLesothoLithuaniaLower middle incomeLuxembourgMacao SAR, ChinaMacedonia, FYRMadagascarMalaysiaMaltaMauritiusMexicoMiddle East & North AfricaMiddle East & North Africa (excluding high income)Middle East & North Africa (IDA & IBRD countries)MoldovaMongoliaMontenegroMoroccoNamibiaNetherlandsNew CaledoniaNew ZealandNicaraguaNorth AmericaNorwayOECD membersOmanPakistanPanamaParaguayPeruPhilippinesPolandPortugalPost-demographic dividendQatarRomaniaRussian FederationRwandaSan MarinoSaudi ArabiaSenegalSerbiaSingaporeSlovak RepublicSloveniaSouth AfricaSouth AsiaSouth Asia (IDA & IBRD)SpainSri LankaSt. LuciaSt. Vincent and the GrenadinesSurinameSwedenSwitzerlandSyrian Arab RepublicTajikistanTanzaniaThailandTimor-LesteTongaTrinidad and TobagoTunisiaTurkeyUkraineUnited Arab EmiratesUnited KingdomUnited StatesUruguayVenezuela, RBWest Bank and GazaZimbabwe
Zeitlinie:
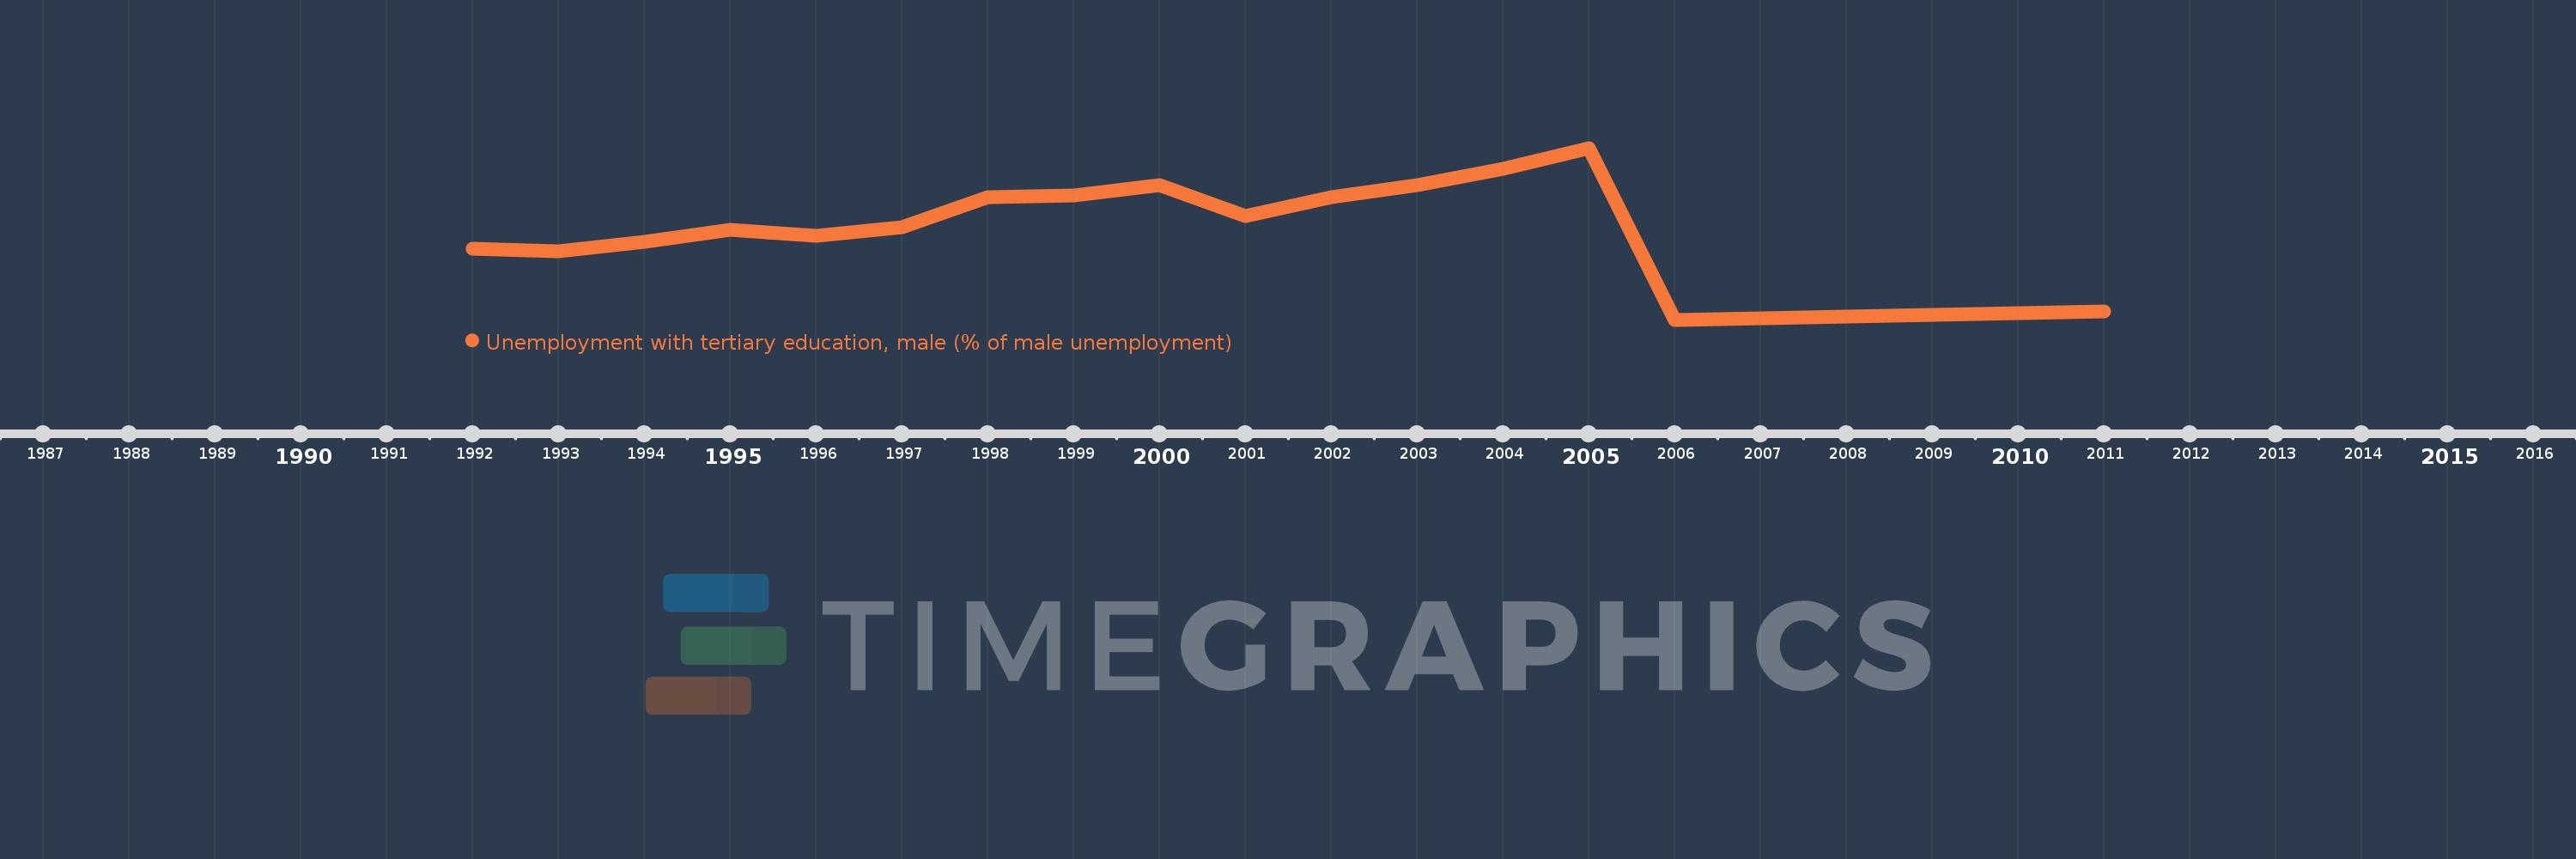
Diese Zeitleiste vorliegt die Graphik ab 1992 J. bis 2011 J. South Asia. Die Angaben bis 1991 J. sind nicht vorhanden. Die Zahl aktueller Beobachtungen nach Daten: 16.
Die Quelle (Bezeichnung):
Kennzahlen der Weltentwicklung
Die Quelle (Einrichtung):
International Labour Organization, Key Indicators of the Labour Market database.
Kategorien:
Social Protection & Labor, Gender
Es wurde aktualisiert:
23 Apr 2017 Jahr
Kennzahlen der Wertänderungen vom Jahr zum Jahr
im Durchschnitt:
26.425
Minimum:
19.658
1 Jan 2006 Jahr
Maximum:
31.614
1 Jan 2005 Jahr
Zum Datum der Beobachtung
Wert
Absolute Veränderung
Die Veränderung bezüglich dem vorherigen Wert
1 Jan 1992 Jahr
24.6
+24.6
0.0%
1 Jan 1993 Jahr
24.4
-0.2
-0.81%
1 Jan 1994 Jahr
25.1
+0.7
2.87%
1 Jan 1995 Jahr
25.9
+0.8
3.19%
1 Jan 1996 Jahr
25.499
-0.401
-1.55%
1 Jan 1997 Jahr
26.102
+0.603
2.37%
1 Jan 1998 Jahr
28.2
+2.098
8.04%
1 Jan 1999 Jahr
28.3
+0.1
0.35%
1 Jan 2000 Jahr
29.0
+0.7
2.47%
1 Jan 2001 Jahr
26.852
-2.148
-7.41%
1 Jan 2002 Jahr
28.202
+1.35
5.03%
1 Jan 2003 Jahr
29.007
+0.805
2.85%
1 Jan 2004 Jahr
30.135
+1.129
3.89%
1 Jan 2005 Jahr
31.614
+1.479
4.91%
1 Jan 2006 Jahr
19.658
-11.956
-37.82%
1 Jan 2011 Jahr
20.224
+0.566
2.88%
Bewertung der Länder gemäß mit laufender Statistik nach Jahren

Kommentare:

Abschicken
PremiumAbout & FeedbackVereinbarungPrivatheit
logo
© 2022 Selected Technologies LLC – Morgan Hill, California