29
/de/
de
AIzaSyAYiBZKx7MnpbEhh9jyipgxe19OcubqV5w
April 1, 2024
219199
Panama
PAN
true
2
1
Unemployment with tertiary education, male (% of male unemployment)
2013,2012,2011,2010,2009,2008,2007,2006,2005,2004,2003,2002,1995,1994,1993,1990,1989,1988,1987,1986
Download
Bibliothek der Globalstatistik →Panama →

Unemployment with tertiary education, male (% of male unemployment)

Diese Statistik in anderen Ländern:
AlbaniaAlgeriaArgentinaArmeniaArubaAustraliaAustriaAzerbaijanBahamas, TheBahrainBangladeshBarbadosBelarusBelgiumBelizeBermudaBhutanBoliviaBosnia and HerzegovinaBotswanaBrazilBritish Virgin IslandsBrunei DarussalamBulgariaBurkina FasoCanadaCaribbean small statesCayman IslandsCentral African RepublicCentral Europe and the BalticsChileColombiaCosta RicaCroatiaCubaCyprusCzech RepublicDenmarkDominicaDominican RepublicEarly-demographic dividendEcuadorEgypt, Arab Rep.El SalvadorEstoniaEthiopiaEuro areaEurope & Central AsiaEurope & Central Asia (excluding high income)Europe & Central Asia (IDA & IBRD countries)European UnionFijiFinlandFranceGabonGeorgiaGermanyGreeceGuatemalaHigh incomeHondurasHong Kong SAR, ChinaHungaryIcelandIndiaIndonesiaIran, Islamic Rep.IrelandIsraelItalyJamaicaJapanJordanKazakhstanKorea, Rep.KosovoKuwaitKyrgyz RepublicLatin America & Caribbean Latin America & Caribbean (excluding high income)Latin America & the Caribbean (IDA & IBRD countries)LatviaLebanonLesothoLithuaniaLower middle incomeLuxembourgMacao SAR, ChinaMacedonia, FYRMadagascarMalaysiaMaltaMauritiusMexicoMiddle East & North AfricaMiddle East & North Africa (excluding high income)Middle East & North Africa (IDA & IBRD countries)MoldovaMongoliaMontenegroMoroccoNamibiaNetherlandsNew CaledoniaNew ZealandNicaraguaNorth AmericaNorwayOECD membersOmanPakistanPanamaParaguayPeruPhilippinesPolandPortugalPost-demographic dividendQatarRomaniaRussian FederationRwandaSan MarinoSaudi ArabiaSenegalSerbiaSingaporeSlovak RepublicSloveniaSouth AfricaSouth AsiaSouth Asia (IDA & IBRD)SpainSri LankaSt. LuciaSt. Vincent and the GrenadinesSurinameSwedenSwitzerlandSyrian Arab RepublicTajikistanTanzaniaThailandTimor-LesteTongaTrinidad and TobagoTunisiaTurkeyUkraineUnited Arab EmiratesUnited KingdomUnited StatesUruguayVenezuela, RBWest Bank and GazaZimbabwe
Zeitlinie:
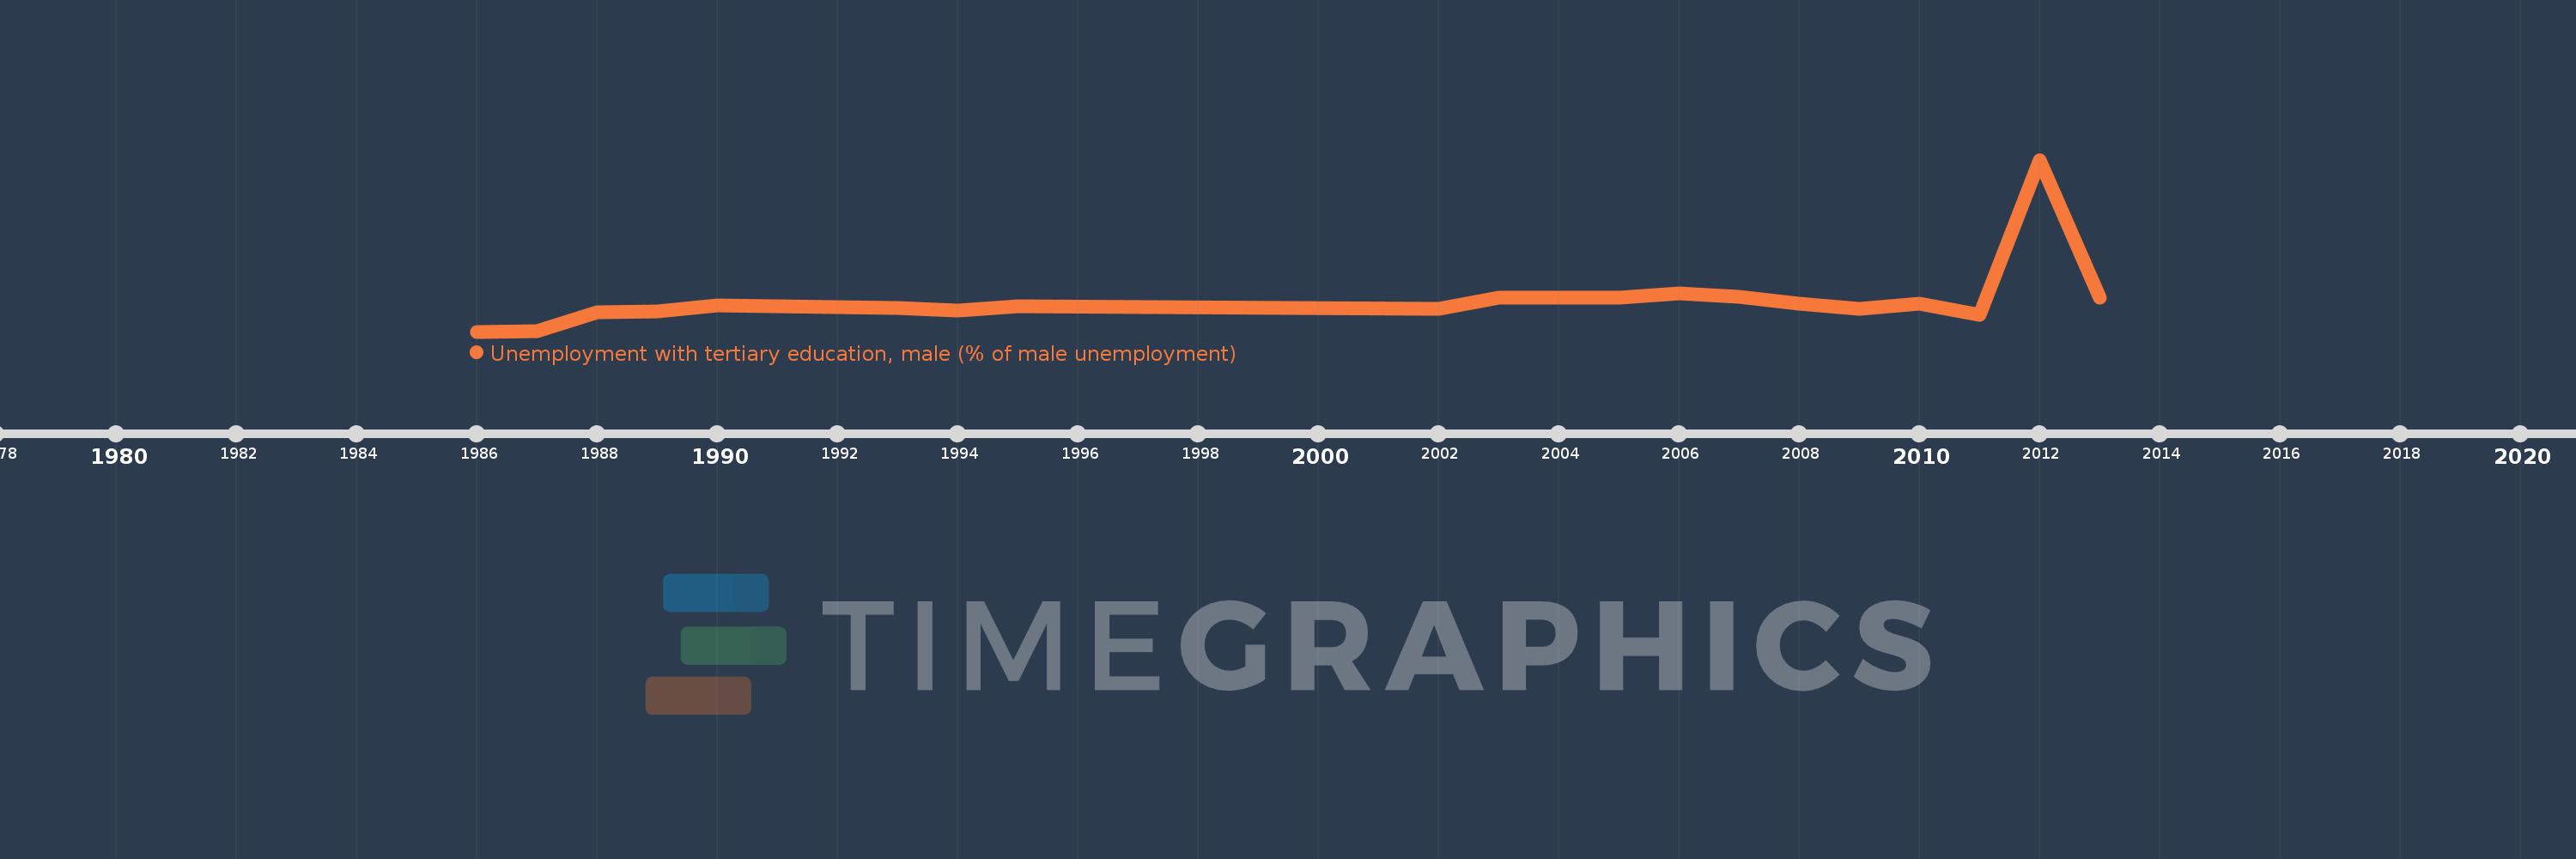
Diese Zeitleiste vorliegt die Graphik ab 1986 J. bis 2013 J. Panama. Die Angaben bis 1985 J. sind nicht vorhanden. Die Zahl aktueller Beobachtungen nach Daten: 20.
Die Quelle (Bezeichnung):
Kennzahlen der Weltentwicklung
Die Quelle (Einrichtung):
International Labour Organization, Key Indicators of the Labour Market database.
Kategorien:
Social Protection & Labor, Gender
Es wurde aktualisiert:
23 Apr 2017 Jahr
Kennzahlen der Wertänderungen vom Jahr zum Jahr
im Durchschnitt:
19.095
Minimum:
10.2
1 Jan 1986 Jahr
Maximum:
58.3
1 Jan 2012 Jahr
Zum Datum der Beobachtung
Wert
Absolute Veränderung
Die Veränderung bezüglich dem vorherigen Wert
1 Jan 1986 Jahr
10.2
+10.2
0.0%
1 Jan 1987 Jahr
10.4
+0.2
1.96%
1 Jan 1988 Jahr
15.6
+5.2
50.0%
1 Jan 1989 Jahr
15.9
+0.3
1.92%
1 Jan 1990 Jahr
17.5
+1.6
10.06%
1 Jan 1993 Jahr
16.8
-0.7
-4.0%
1 Jan 1994 Jahr
16.1
-0.7
-4.17%
1 Jan 1995 Jahr
17.4
+1.3
8.07%
1 Jan 2002 Jahr
16.6
-0.8
-4.6%
1 Jan 2003 Jahr
19.6
+3.0
18.07%
1 Jan 2004 Jahr
19.8
+0.2
1.02%
1 Jan 2005 Jahr
19.8
0.0
0.0%
1 Jan 2006 Jahr
20.9
+1.1
5.56%
1 Jan 2007 Jahr
19.9
-1.0
-4.78%
1 Jan 2008 Jahr
18.1
-1.8
-9.05%
1 Jan 2009 Jahr
16.5
-1.6
-8.84%
1 Jan 2010 Jahr
17.9
+1.4
8.48%
1 Jan 2011 Jahr
14.9
-3.0
-16.76%
1 Jan 2012 Jahr
58.3
+43.4
291.28%
1 Jan 2013 Jahr
19.7
-38.6
-66.21%
Bewertung der Länder gemäß mit laufender Statistik nach Jahren

Kommentare:

Abschicken
PremiumAbout & FeedbackVereinbarungPrivatheit
logo
© 2022 Selected Technologies LLC – Morgan Hill, California