33
/de/
AIzaSyAYiBZKx7MnpbEhh9jyipgxe19OcubqV5w
August 1, 2025
57778
South Asia
SAS
false
2
1
Unemployment with secondary education, male (% of male unemployment)
2011,2006,2005,2004,2003,2002,2001,2000,1999,1998,1997,1996,1995,1994,1993,1992
Download
Bibliothek der Globalstatistik →South Asia →

Unemployment with secondary education, male (% of male unemployment)

Diese Statistik in anderen Ländern:

AlbaniaAlgeriaArgentinaArmeniaArubaAustraliaAustriaAzerbaijanBahamas, TheBahrainBangladeshBarbadosBelarusBelgiumBelizeBermudaBhutanBoliviaBosnia and HerzegovinaBotswanaBrazilBritish Virgin IslandsBrunei DarussalamBulgariaBurkina FasoCanadaCaribbean small statesCayman IslandsCentral African RepublicCentral Europe and the BalticsChileColombiaCosta RicaCroatiaCubaCyprusCzech RepublicDenmarkDominicaDominican RepublicEarly-demographic dividendEcuadorEgypt, Arab Rep.El SalvadorEstoniaEthiopiaEuro areaEurope & Central AsiaEurope & Central Asia (excluding high income)Europe & Central Asia (IDA & IBRD countries)European UnionFijiFinlandFranceGabonGeorgiaGermanyGreeceGuatemalaHigh incomeHondurasHong Kong SAR, ChinaHungaryIcelandIndiaIndonesiaIran, Islamic Rep.IrelandIsraelItalyJamaicaJapanJordanKazakhstanKorea, Rep.KosovoKuwaitKyrgyz RepublicLatin America & Caribbean Latin America & Caribbean (excluding high income)Latin America & the Caribbean (IDA & IBRD countries)LatviaLebanonLesothoLithuaniaLower middle incomeLuxembourgMacao SAR, ChinaMacedonia, FYRMadagascarMalaysiaMaltaMauritiusMexicoMiddle East & North AfricaMiddle East & North Africa (excluding high income)Middle East & North Africa (IDA & IBRD countries)MoldovaMongoliaMontenegroMoroccoNamibiaNetherlandsNew CaledoniaNew ZealandNicaraguaNorth AmericaNorwayOECD membersOmanPakistanPanamaParaguayPeruPhilippinesPolandPortugalPost-demographic dividendQatarRomaniaRussian FederationRwandaSan MarinoSaudi ArabiaSenegalSerbiaSingaporeSlovak RepublicSloveniaSouth AfricaSouth AsiaSouth Asia (IDA & IBRD)SpainSri LankaSt. LuciaSt. Vincent and the GrenadinesSurinameSwedenSwitzerlandSyrian Arab RepublicTajikistanTanzaniaThailandTimor-LesteTongaTrinidad and TobagoTunisiaTurkeyUkraineUnited Arab EmiratesUnited KingdomUnited StatesUruguayVenezuela, RBWest Bank and GazaZimbabwe

Zeitlinie:

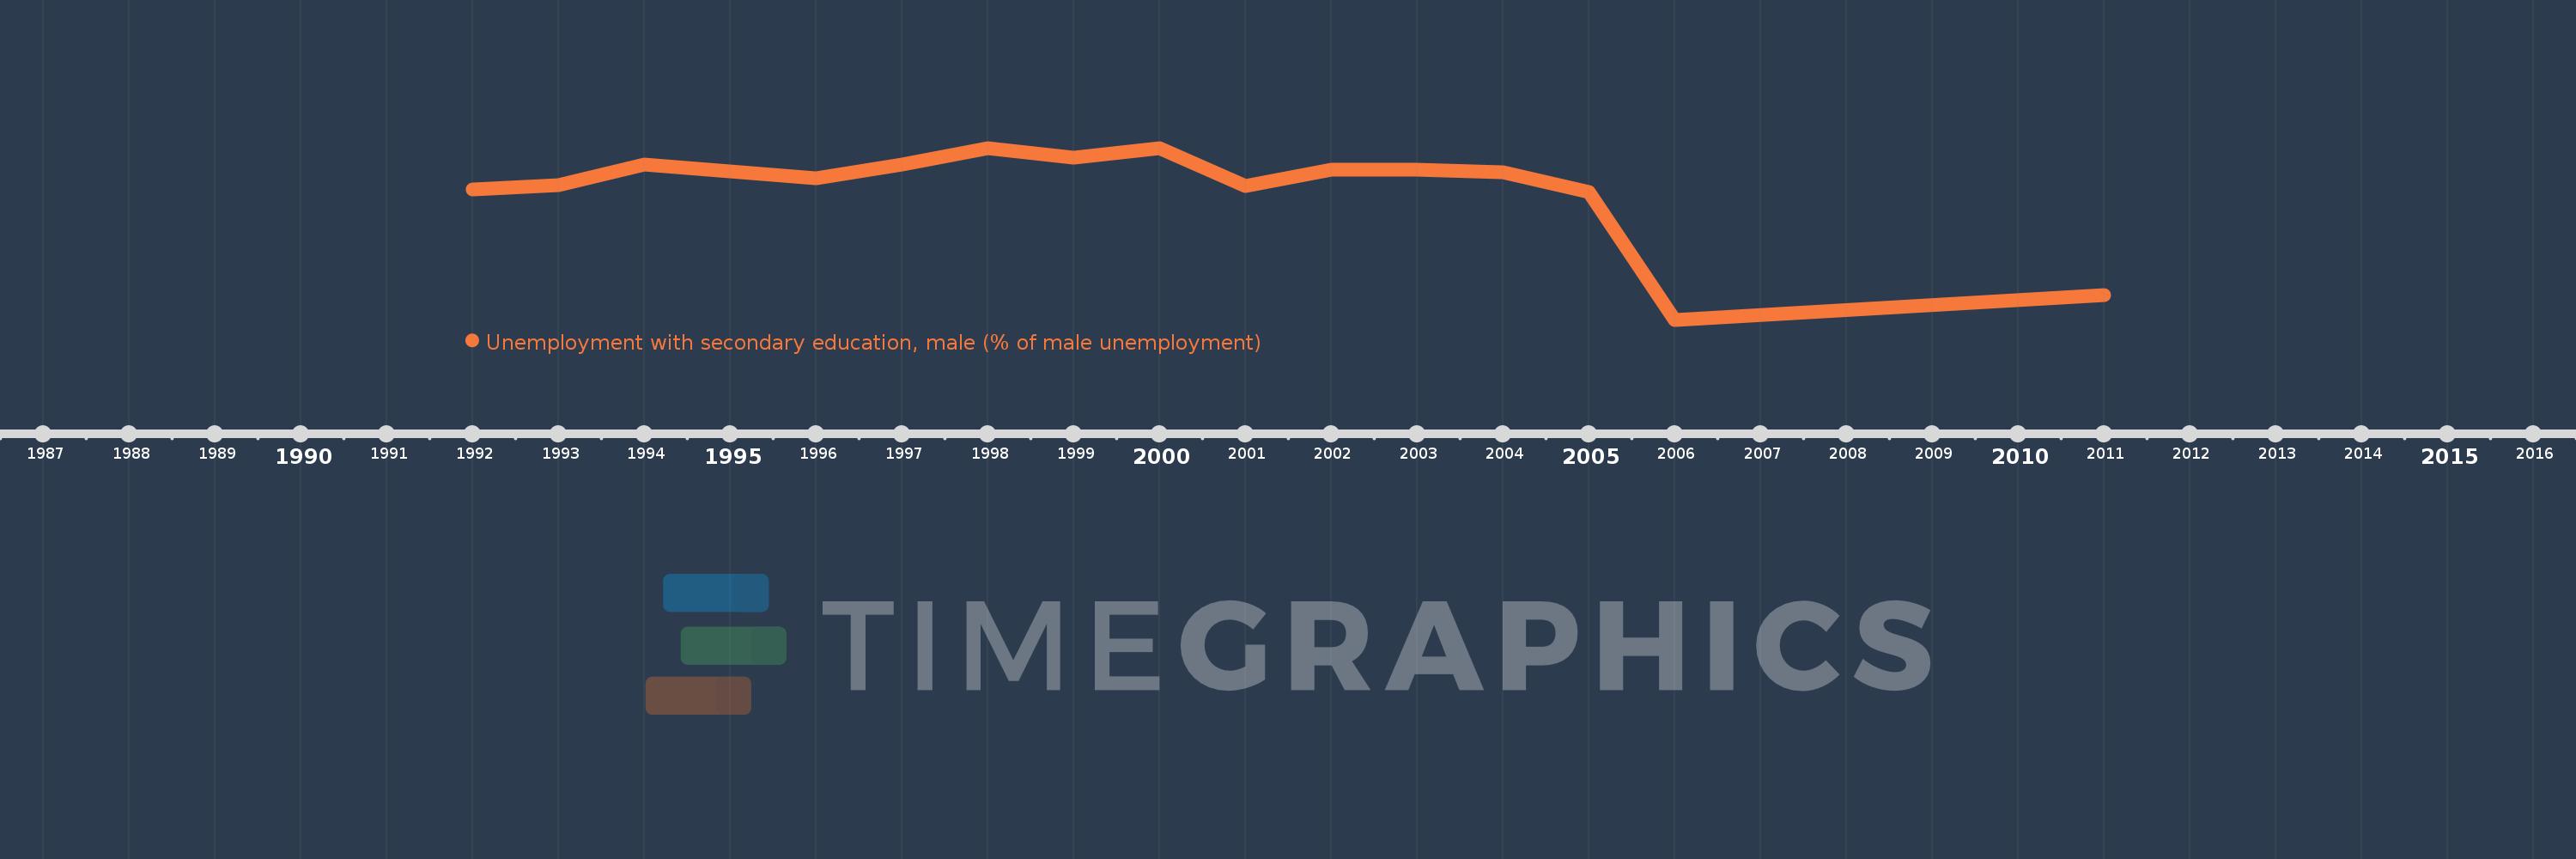
Diese Zeitleiste vorliegt die Graphik ab 1992 J. bis 2011 J. South Asia. Die Angaben bis 1991 J. sind nicht vorhanden. Die Zahl aktueller Beobachtungen nach Daten: 16.

Die Quelle (Bezeichnung):

Kennzahlen der Weltentwicklung

Die Quelle (Einrichtung):

International Labour Organization, Key Indicators of the Labour Market database.

Kategorien:

Social Protection & Labor, Gender

Es wurde aktualisiert:

23 Apr 2017 Jahr

Kennzahlen der Wertänderungen vom Jahr zum Jahr

im Durchschnitt:
35.621
Minimum:
22.338
1 Jan 2006 Jahr
Maximum:
39.7
1 Jan 1998 Jahr
Zum Datum der Beobachtung
Wert
Absolute Veränderung
Die Veränderung bezüglich dem vorherigen Wert
1 Jan 1992 Jahr
35.5
+35.5
0.0%
1 Jan 1993 Jahr
35.9
+0.4
1.13%
1 Jan 1994 Jahr
38.0
+2.1
5.85%
1 Jan 1995 Jahr
37.3
-0.7
-1.84%
1 Jan 1996 Jahr
36.651
-0.649
-1.74%
1 Jan 1997 Jahr
38.013
+1.362
3.72%
1 Jan 1998 Jahr
39.7
+1.687
4.44%
1 Jan 1999 Jahr
38.7
-1.0
-2.52%
1 Jan 2000 Jahr
39.7
+1.0
2.58%
1 Jan 2001 Jahr
35.818
-3.882
-9.78%
1 Jan 2002 Jahr
37.515
+1.697
4.74%
1 Jan 2003 Jahr
37.467
-0.048
-0.13%
1 Jan 2004 Jahr
37.268
-0.199
-0.53%
1 Jan 2005 Jahr
35.213
-2.055
-5.51%
1 Jan 2006 Jahr
22.338
-12.875
-36.56%
1 Jan 2011 Jahr
24.858
+2.52
11.28%

Bewertung der Länder gemäß mit laufender Statistik nach Jahren