33
/de/
AIzaSyAYiBZKx7MnpbEhh9jyipgxe19OcubqV5w
August 1, 2025
196409
Mexico
MEX
true
2
1
Unemployment with secondary education, male (% of male unemployment)
2012,2009,2008,2007,2006,2005,2004,2003,2002,2001,2000,1999,1998,1997,1996,1994,1992
Download
Bibliothek der Globalstatistik →Mexico →

Unemployment with secondary education, male (% of male unemployment)

Diese Statistik in anderen Ländern:

AlbaniaAlgeriaArgentinaArmeniaArubaAustraliaAustriaAzerbaijanBahamas, TheBahrainBangladeshBarbadosBelarusBelgiumBelizeBermudaBhutanBoliviaBosnia and HerzegovinaBotswanaBrazilBritish Virgin IslandsBrunei DarussalamBulgariaBurkina FasoCanadaCaribbean small statesCayman IslandsCentral African RepublicCentral Europe and the BalticsChileColombiaCosta RicaCroatiaCubaCyprusCzech RepublicDenmarkDominicaDominican RepublicEarly-demographic dividendEcuadorEgypt, Arab Rep.El SalvadorEstoniaEthiopiaEuro areaEurope & Central AsiaEurope & Central Asia (excluding high income)Europe & Central Asia (IDA & IBRD countries)European UnionFijiFinlandFranceGabonGeorgiaGermanyGreeceGuatemalaHigh incomeHondurasHong Kong SAR, ChinaHungaryIcelandIndiaIndonesiaIran, Islamic Rep.IrelandIsraelItalyJamaicaJapanJordanKazakhstanKorea, Rep.KosovoKuwaitKyrgyz RepublicLatin America & Caribbean Latin America & Caribbean (excluding high income)Latin America & the Caribbean (IDA & IBRD countries)LatviaLebanonLesothoLithuaniaLower middle incomeLuxembourgMacao SAR, ChinaMacedonia, FYRMadagascarMalaysiaMaltaMauritiusMexicoMiddle East & North AfricaMiddle East & North Africa (excluding high income)Middle East & North Africa (IDA & IBRD countries)MoldovaMongoliaMontenegroMoroccoNamibiaNetherlandsNew CaledoniaNew ZealandNicaraguaNorth AmericaNorwayOECD membersOmanPakistanPanamaParaguayPeruPhilippinesPolandPortugalPost-demographic dividendQatarRomaniaRussian FederationRwandaSan MarinoSaudi ArabiaSenegalSerbiaSingaporeSlovak RepublicSloveniaSouth AfricaSouth AsiaSouth Asia (IDA & IBRD)SpainSri LankaSt. LuciaSt. Vincent and the GrenadinesSurinameSwedenSwitzerlandSyrian Arab RepublicTajikistanTanzaniaThailandTimor-LesteTongaTrinidad and TobagoTunisiaTurkeyUkraineUnited Arab EmiratesUnited KingdomUnited StatesUruguayVenezuela, RBWest Bank and GazaZimbabwe

Zeitlinie:

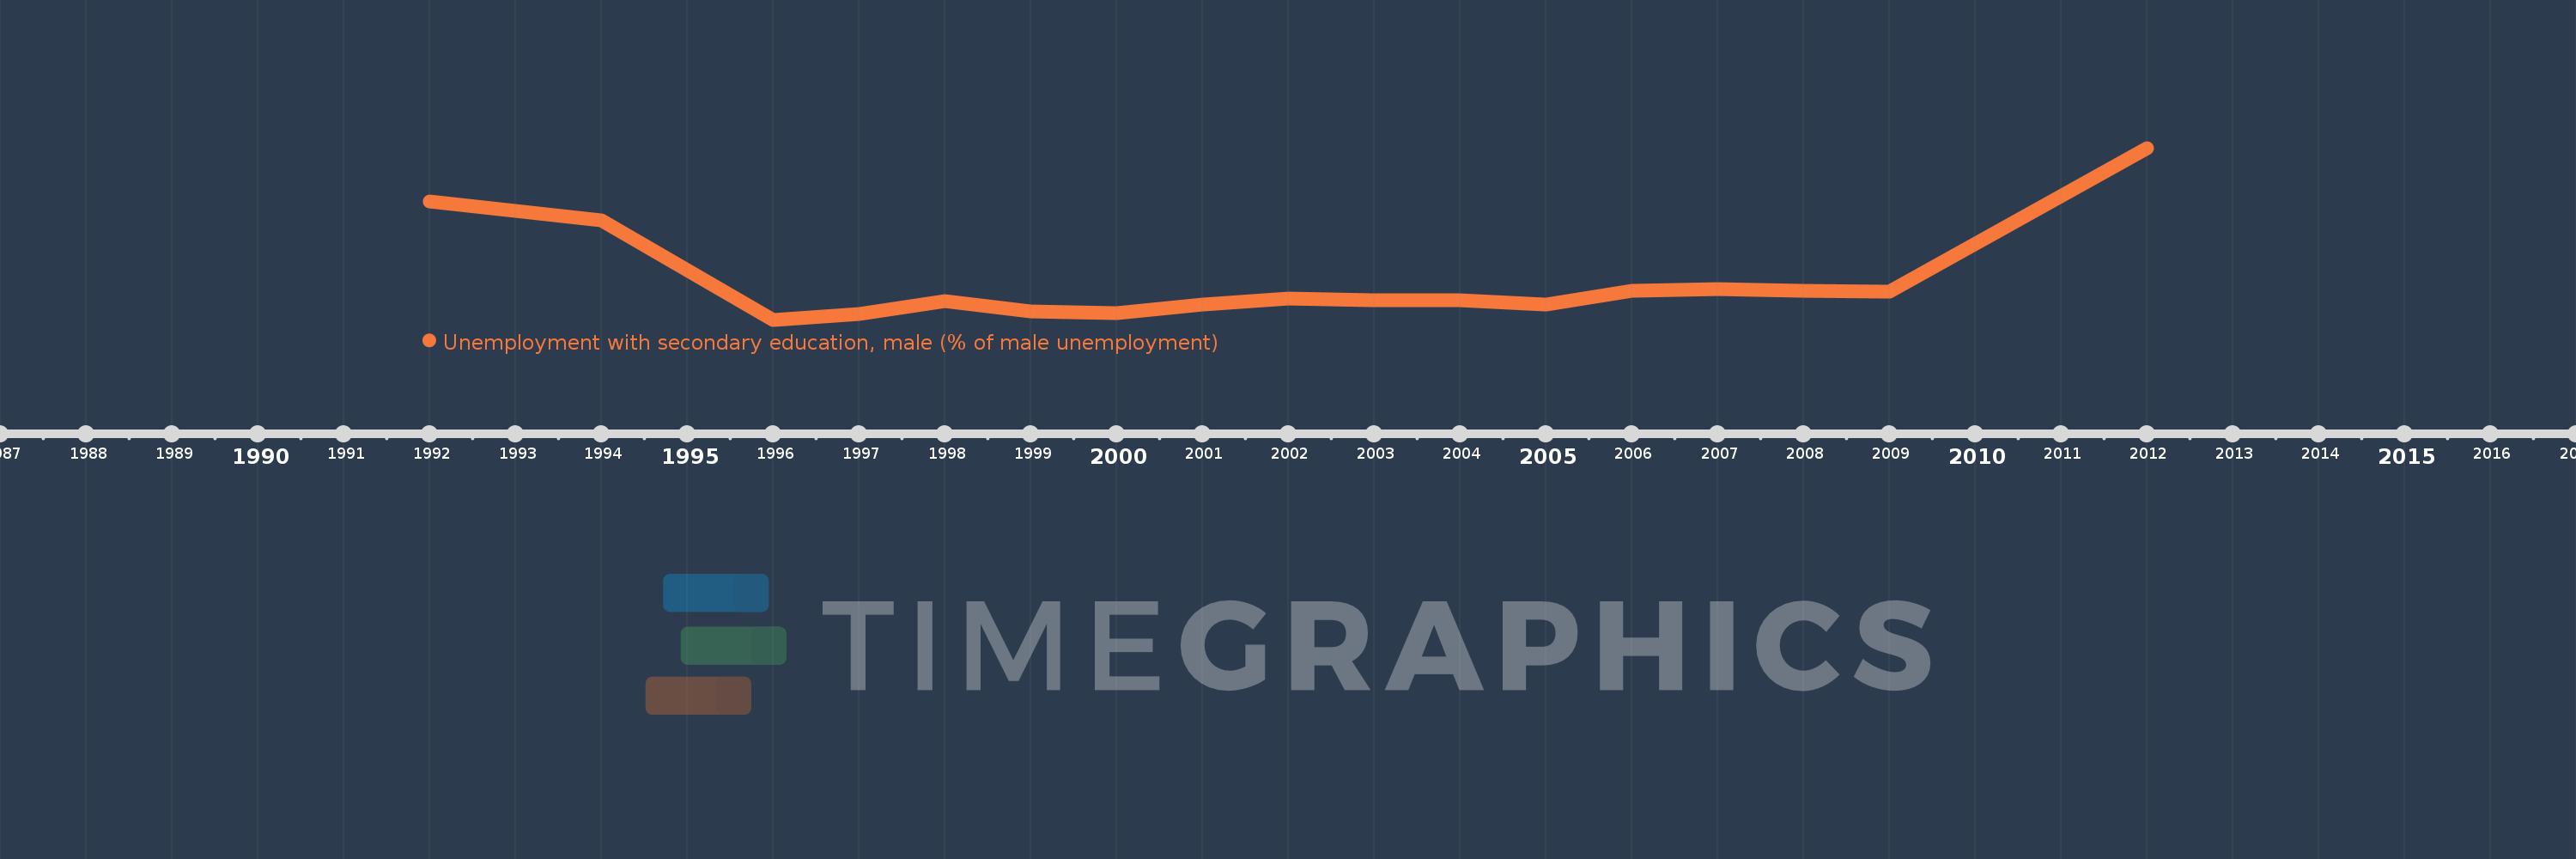
Diese Zeitleiste vorliegt die Graphik ab 1992 J. bis 2012 J. Mexico. Die Angaben bis 1991 J. sind nicht vorhanden. Die Zahl aktueller Beobachtungen nach Daten: 17.

Die Quelle (Bezeichnung):

Kennzahlen der Weltentwicklung

Die Quelle (Einrichtung):

International Labour Organization, Key Indicators of the Labour Market database.

Kategorien:

Social Protection & Labor, Gender

Es wurde aktualisiert:

23 Apr 2017 Jahr

Kennzahlen der Wertänderungen vom Jahr zum Jahr

im Durchschnitt:
23.382
Minimum:
15.2
1 Jan 1996 Jahr
Maximum:
52.8
1 Jan 2012 Jahr
Zum Datum der Beobachtung
Wert
Absolute Veränderung
Die Veränderung bezüglich dem vorherigen Wert
1 Jan 1992 Jahr
41.1
+41.1
0.0%
1 Jan 1994 Jahr
37.0
-4.1
-9.98%
1 Jan 1996 Jahr
15.2
-21.8
-58.92%
1 Jan 1997 Jahr
16.4
+1.2
7.89%
1 Jan 1998 Jahr
19.2
+2.8
17.07%
1 Jan 1999 Jahr
17.0
-2.2
-11.46%
1 Jan 2000 Jahr
16.6
-0.4
-2.35%
1 Jan 2001 Jahr
18.5
+1.9
11.45%
1 Jan 2002 Jahr
19.9
+1.4
7.57%
1 Jan 2003 Jahr
19.5
-0.4
-2.01%
1 Jan 2004 Jahr
19.4
-0.1
-0.51%
1 Jan 2005 Jahr
18.5
-0.9
-4.64%
1 Jan 2006 Jahr
21.5
+3.0
16.22%
1 Jan 2007 Jahr
22.0
+0.5
2.33%
1 Jan 2008 Jahr
21.6
-0.4
-1.82%
1 Jan 2009 Jahr
21.3
-0.3
-1.39%
1 Jan 2012 Jahr
52.8
+31.5
147.89%

Bewertung der Länder gemäß mit laufender Statistik nach Jahren