33
/de/
AIzaSyAYiBZKx7MnpbEhh9jyipgxe19OcubqV5w
August 1, 2025
39345
IDA only
IDX
false
2
1
Percentage of teachers in secondary education who are trained, both sexes (%)
2015,2014,2013,2012,2011,2010,2009,2008,2007,2006,2005,2004,2003,2002,2001,2000,1999
Download
Bibliothek der Globalstatistik →IDA only →

Percentage of teachers in secondary education who are trained, both sexes (%)

Diese Statistik in anderen Ländern:

AndorraAntigua and BarbudaArab WorldArubaBahamas, TheBahrainBangladeshBarbadosBelarusBelizeBeninBermudaBhutanBotswanaBritish Virgin IslandsBrunei DarussalamBurkina FasoBurundiCabo VerdeCambodiaCameroonCaribbean small statesCayman IslandsChadColombiaComorosCongo, Dem. Rep.Congo, Rep.Costa RicaCote d'IvoireCroatiaCubaDjiboutiDominicaDominican RepublicEcuadorEgypt, Arab Rep.El SalvadorEquatorial GuineaEritreaEthiopiaFijiFragile and conflict affected situationsGambia, TheGeorgiaGhanaGibraltarGrenadaGuineaGuyanaHeavily indebted poor countries (HIPC)HondurasHong Kong SAR, ChinaIDA blendIDA onlyIDA totalIran, Islamic Rep.IraqJamaicaKazakhstanKenyaKiribatiKuwaitKyrgyz RepublicLao PDRLatin America & Caribbean Latin America & Caribbean (excluding high income)Latin America & the Caribbean (IDA & IBRD countries)Least developed countries: UN classificationLebanonLesothoLiberiaLow incomeMacao SAR, ChinaMadagascarMalawiMalaysiaMaldivesMaliMauritaniaMauritiusMexicoMiddle East & North AfricaMiddle East & North Africa (excluding high income)Middle East & North Africa (IDA & IBRD countries)MongoliaMozambiqueMyanmarNamibiaNauruNepalNicaraguaNigerNigeriaOmanOther small statesPacific island small statesPanamaPapua New GuineaParaguayPeruPhilippinesPre-demographic dividendQatarRwandaSao Tome and PrincipeSaudi ArabiaSerbiaSeychellesSierra LeoneSingaporeSmall statesSolomon IslandsSri LankaSt. Kitts and NevisSt. LuciaSt. Vincent and the GrenadinesSub-Saharan Africa Sub-Saharan Africa (excluding high income)Sub-Saharan Africa (IDA & IBRD countries)SudanSurinameSwazilandSyrian Arab RepublicTajikistanTogoTongaTurks and Caicos IslandsUgandaUnited Arab EmiratesUzbekistanWest Bank and GazaZimbabwe

Zeitlinie:

Diese Zeitleiste vorliegt die Graphik ab 1999 J. bis 2015 J. IDA only. Die Angaben bis 1998 J. sind nicht vorhanden. Die Zahl aktueller Beobachtungen nach Daten: 17.

Die Quelle (Bezeichnung):

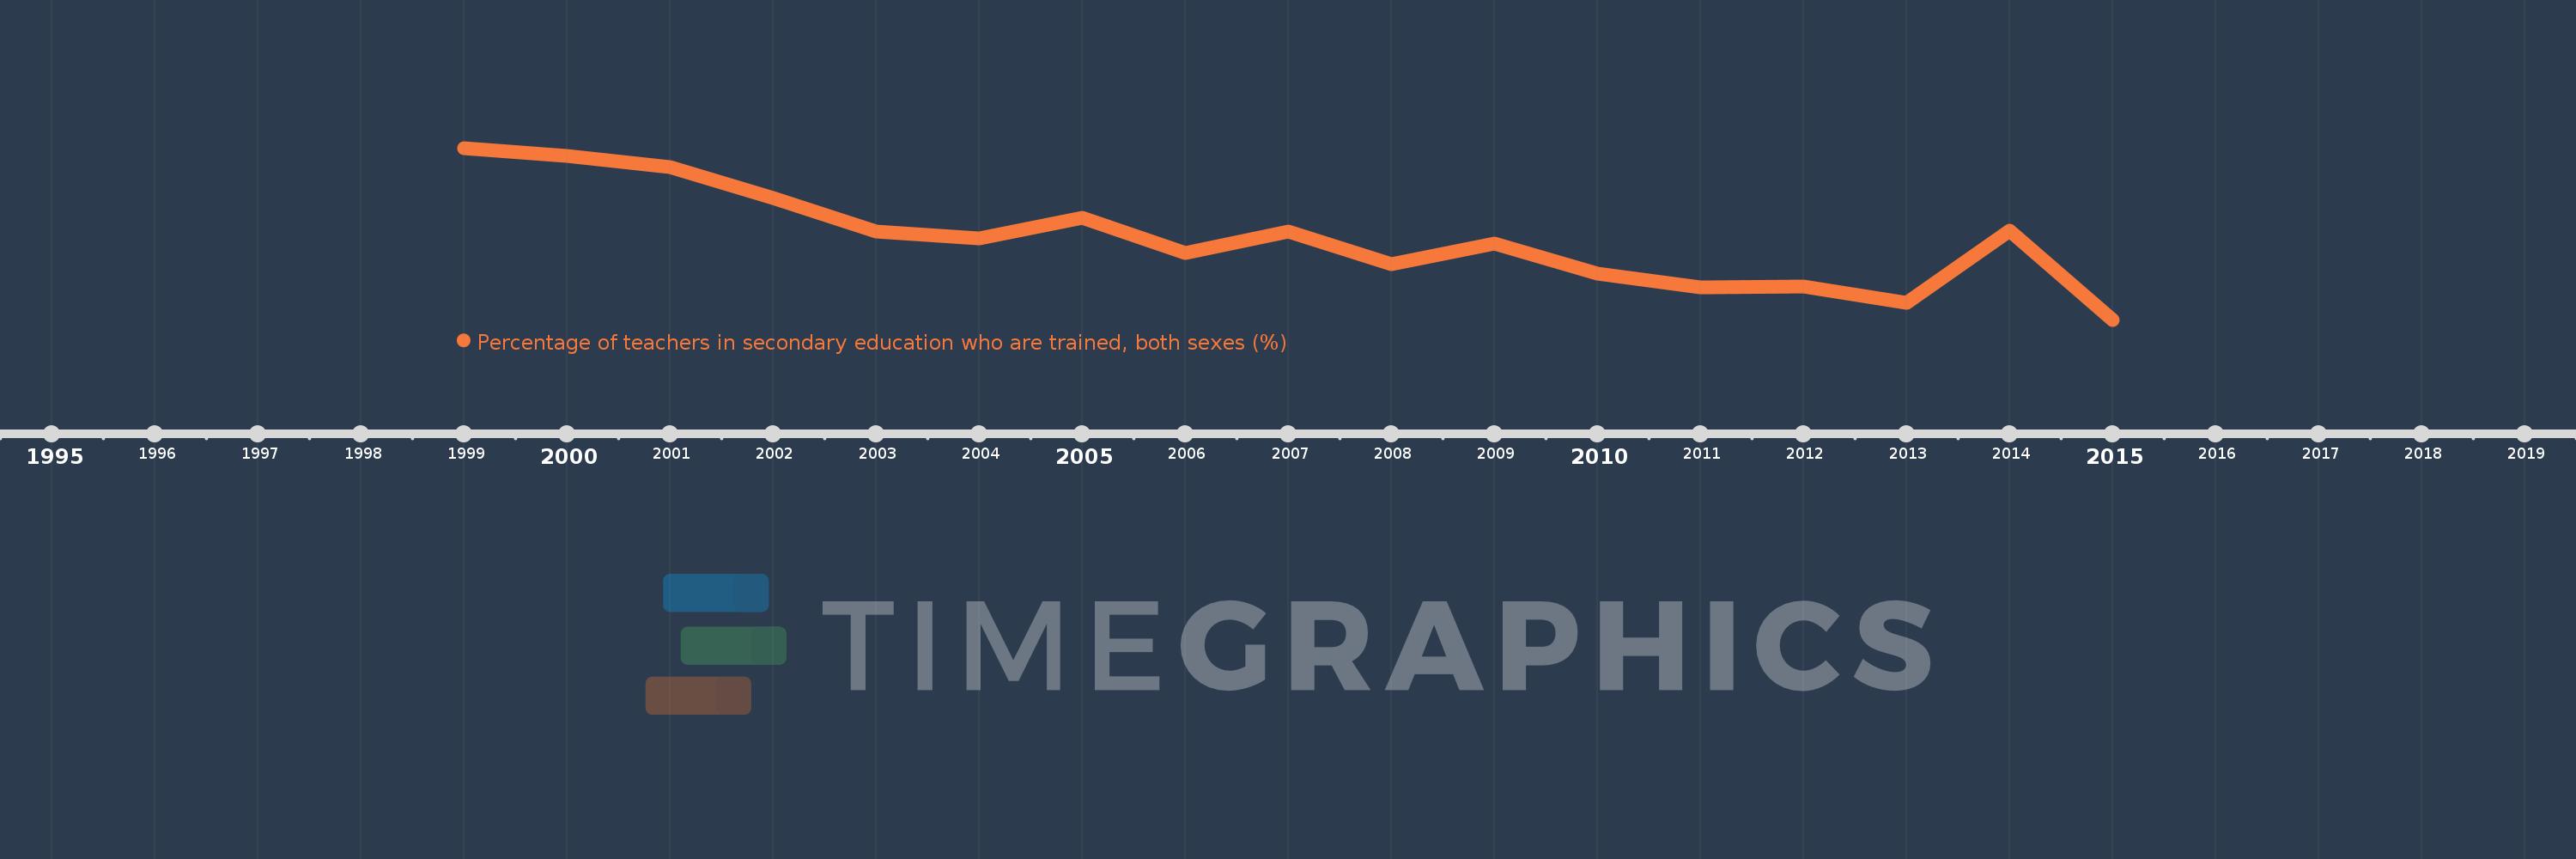
Kennzahlen der Weltentwicklung

Die Quelle (Einrichtung):

UNESCO Institute for Statistics

Kategorien:

Education

Es wurde aktualisiert:

23 Apr 2017 Jahr

Kennzahlen der Wertänderungen vom Jahr zum Jahr

im Durchschnitt:
63.544
Minimum:
58.906
1 Jan 2015 Jahr
Maximum:
68.676
1 Jan 1999 Jahr
Zum Datum der Beobachtung
Wert
Absolute Veränderung
Die Veränderung bezüglich dem vorherigen Wert
1 Jan 1999 Jahr
68.676
+68.676
0.0%
1 Jan 2000 Jahr
68.244
-0.432
-0.63%
1 Jan 2001 Jahr
67.57
-0.673
-0.99%
1 Jan 2002 Jahr
65.81
-1.761
-2.61%
1 Jan 2003 Jahr
63.943
-1.867
-2.84%
1 Jan 2004 Jahr
63.543
-0.4
-0.63%
1 Jan 2005 Jahr
64.695
+1.152
1.81%
1 Jan 2006 Jahr
62.703
-1.992
-3.08%
1 Jan 2007 Jahr
63.932
+1.229
1.96%
1 Jan 2008 Jahr
62.074
-1.859
-2.91%
1 Jan 2009 Jahr
63.224
+1.15
1.85%
1 Jan 2010 Jahr
61.552
-1.671
-2.64%
1 Jan 2011 Jahr
60.733
-0.819
-1.33%
1 Jan 2012 Jahr
60.809
+0.076
0.13%
1 Jan 2013 Jahr
59.88
-0.929
-1.53%
1 Jan 2014 Jahr
63.951
+4.071
6.8%
1 Jan 2015 Jahr
58.906
-5.045
-7.89%

Bewertung der Länder gemäß mit laufender Statistik nach Jahren