29
/de/
de
AIzaSyAYiBZKx7MnpbEhh9jyipgxe19OcubqV5w
April 1, 2024
218818
Panama
PAN
true
2
1
Percentage of teachers in secondary education who are trained, both sexes (%)
2013,2012,2011,2010,2009,2008,2007,2006,2005,2003,2002,2001,2000
Download
Bibliothek der Globalstatistik →Panama →

Percentage of teachers in secondary education who are trained, both sexes (%)

Diese Statistik in anderen Ländern:
AndorraAntigua and BarbudaArab WorldArubaBahamas, TheBahrainBangladeshBarbadosBelarusBelizeBeninBermudaBhutanBotswanaBritish Virgin IslandsBrunei DarussalamBurkina FasoBurundiCabo VerdeCambodiaCameroonCaribbean small statesCayman IslandsChadColombiaComorosCongo, Dem. Rep.Congo, Rep.Costa RicaCote d'IvoireCroatiaCubaDjiboutiDominicaDominican RepublicEcuadorEgypt, Arab Rep.El SalvadorEquatorial GuineaEritreaEthiopiaFijiFragile and conflict affected situationsGambia, TheGeorgiaGhanaGibraltarGrenadaGuineaGuyanaHeavily indebted poor countries (HIPC)HondurasHong Kong SAR, ChinaIDA blendIDA onlyIDA totalIran, Islamic Rep.IraqJamaicaKazakhstanKenyaKiribatiKuwaitKyrgyz RepublicLao PDRLatin America & Caribbean Latin America & Caribbean (excluding high income)Latin America & the Caribbean (IDA & IBRD countries)Least developed countries: UN classificationLebanonLesothoLiberiaLow incomeMacao SAR, ChinaMadagascarMalawiMalaysiaMaldivesMaliMauritaniaMauritiusMexicoMiddle East & North AfricaMiddle East & North Africa (excluding high income)Middle East & North Africa (IDA & IBRD countries)MongoliaMozambiqueMyanmarNamibiaNauruNepalNicaraguaNigerNigeriaOmanOther small statesPacific island small statesPanamaPapua New GuineaParaguayPeruPhilippinesPre-demographic dividendQatarRwandaSao Tome and PrincipeSaudi ArabiaSerbiaSeychellesSierra LeoneSingaporeSmall statesSolomon IslandsSri LankaSt. Kitts and NevisSt. LuciaSt. Vincent and the GrenadinesSub-Saharan Africa Sub-Saharan Africa (excluding high income)Sub-Saharan Africa (IDA & IBRD countries)SudanSurinameSwazilandSyrian Arab RepublicTajikistanTogoTongaTurks and Caicos IslandsUgandaUnited Arab EmiratesUzbekistanWest Bank and GazaZimbabwe
Zeitlinie:
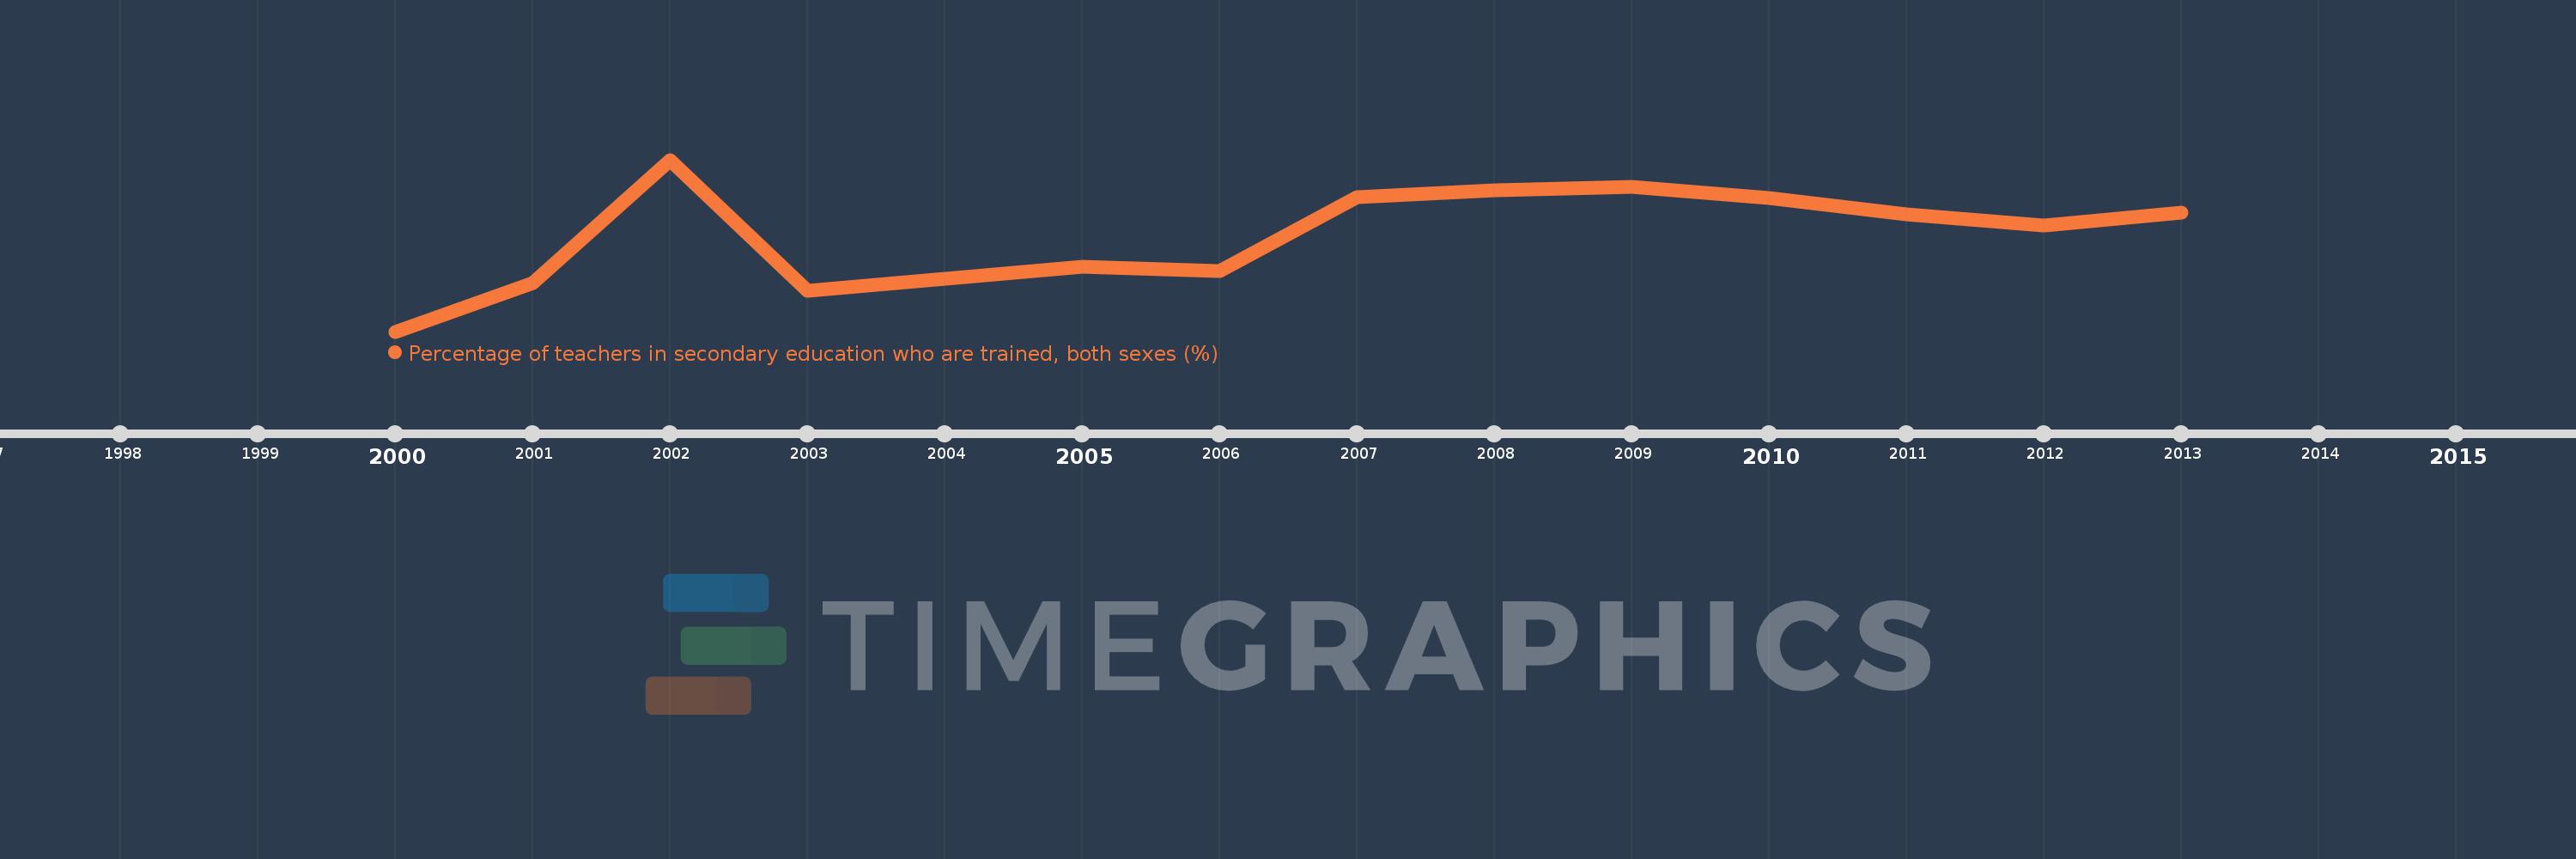
Diese Zeitleiste vorliegt die Graphik ab 2000 J. bis 2013 J. Panama. Die Angaben bis 1999 J. sind nicht vorhanden. Die Zahl aktueller Beobachtungen nach Daten: 13.
Die Quelle (Bezeichnung):
Kennzahlen der Weltentwicklung
Die Quelle (Einrichtung):
UNESCO Institute for Statistics
Kategorien:
Education
Es wurde aktualisiert:
23 Apr 2017 Jahr
Kennzahlen der Wertänderungen vom Jahr zum Jahr
im Durchschnitt:
86.588
Minimum:
77.302
1 Jan 2000 Jahr
Maximum:
93.479
1 Jan 2002 Jahr
Zum Datum der Beobachtung
Wert
Absolute Veränderung
Die Veränderung bezüglich dem vorherigen Wert
1 Jan 2000 Jahr
77.302
+77.302
0.0%
1 Jan 2001 Jahr
81.901
+4.599
5.95%
1 Jan 2002 Jahr
93.479
+11.578
14.14%
1 Jan 2003 Jahr
81.125
-12.354
-13.22%
1 Jan 2005 Jahr
83.438
+2.313
2.85%
1 Jan 2006 Jahr
82.967
-0.471
-0.56%
1 Jan 2007 Jahr
89.961
+6.994
8.43%
1 Jan 2008 Jahr
90.592
+0.63
0.7%
1 Jan 2009 Jahr
90.933
+0.341
0.38%
1 Jan 2010 Jahr
89.851
-1.082
-1.19%
1 Jan 2011 Jahr
88.347
-1.504
-1.67%
1 Jan 2012 Jahr
87.284
-1.063
-1.2%
1 Jan 2013 Jahr
88.47
+1.186
1.36%
Bewertung der Länder gemäß mit laufender Statistik nach Jahren

Kommentare:

Abschicken
PremiumAbout & FeedbackVereinbarungPrivatheit
logo
© 2022 Selected Technologies LLC – Morgan Hill, California