33
/de/
AIzaSyAYiBZKx7MnpbEhh9jyipgxe19OcubqV5w
August 1, 2025
37965
IDA blend
IDB
false
2
1
Bank liquid reserves to bank assets ratio (%)
2016,2015,2014,2013,2012,2011,2010,2009,2008,2007,2006,2005,2004,2003,2002
Download
Bibliothek der Globalstatistik →IDA blend →

Bank liquid reserves to bank assets ratio (%)

Diese Statistik in anderen Ländern:

AfghanistanAlbaniaAlgeriaAngolaAntigua and BarbudaArab WorldArmeniaAustraliaAzerbaijanBangladeshBarbadosBelarusBelizeBeninBhutanBoliviaBosnia and HerzegovinaBotswanaBrazilBrunei DarussalamBulgariaBurkina FasoBurundiCabo VerdeCambodiaCameroonCanadaCaribbean small statesCentral African RepublicCentral Europe and the BalticsChadChileColombiaComorosCongo, Dem. Rep.Congo, Rep.Costa RicaCote d'IvoireCroatiaCzech RepublicDenmarkDominicaDominican RepublicEarly-demographic dividendEast Asia & Pacific (excluding high income)East Asia & Pacific (IDA & IBRD countries)Egypt, Arab Rep.Equatorial GuineaEritreaEurope & Central Asia (excluding high income)Europe & Central Asia (IDA & IBRD countries)FijiFragile and conflict affected situationsGabonGambia, TheGeorgiaGhanaGrenadaGuatemalaGuinea-BissauGuyanaHaitiHeavily indebted poor countries (HIPC)HondurasHungaryIBRD onlyIcelandIDA & IBRD totalIDA blendIDA onlyIDA totalIndonesiaIraqIsraelJamaicaJapanKazakhstanKenyaKorea, Rep.KosovoKuwaitKyrgyz RepublicLate-demographic dividendLatin America & Caribbean Latin America & Caribbean (excluding high income)Latin America & the Caribbean (IDA & IBRD countries)Least developed countries: UN classificationLesothoLow & middle incomeLow incomeLower middle incomeMacao SAR, ChinaMacedonia, FYRMalaysiaMaldivesMaliMauritiusMexicoMiddle incomeMoldovaMongoliaMoroccoMozambiqueMyanmarNamibiaNepalNicaraguaNigerNigeriaNorwayOmanOther small statesPakistanPanamaPapua New GuineaParaguayPhilippinesPolandPre-demographic dividendQatarRomaniaRussian FederationRwandaSamoaSao Tome and PrincipeSenegalSerbiaSeychellesSierra LeoneSmall statesSolomon IslandsSouth AfricaSouth AsiaSouth Asia (IDA & IBRD)South SudanSri LankaSt. Kitts and NevisSt. LuciaSt. Vincent and the GrenadinesSub-Saharan Africa Sub-Saharan Africa (excluding high income)Sub-Saharan Africa (IDA & IBRD countries)SudanSurinameSwazilandSwedenSyrian Arab RepublicTajikistanTanzaniaThailandTogoTongaTrinidad and TobagoTurkeyUgandaUkraineUnited Arab EmiratesUpper middle incomeUruguayVanuatuVenezuela, RBWorldZambia

Zeitlinie:

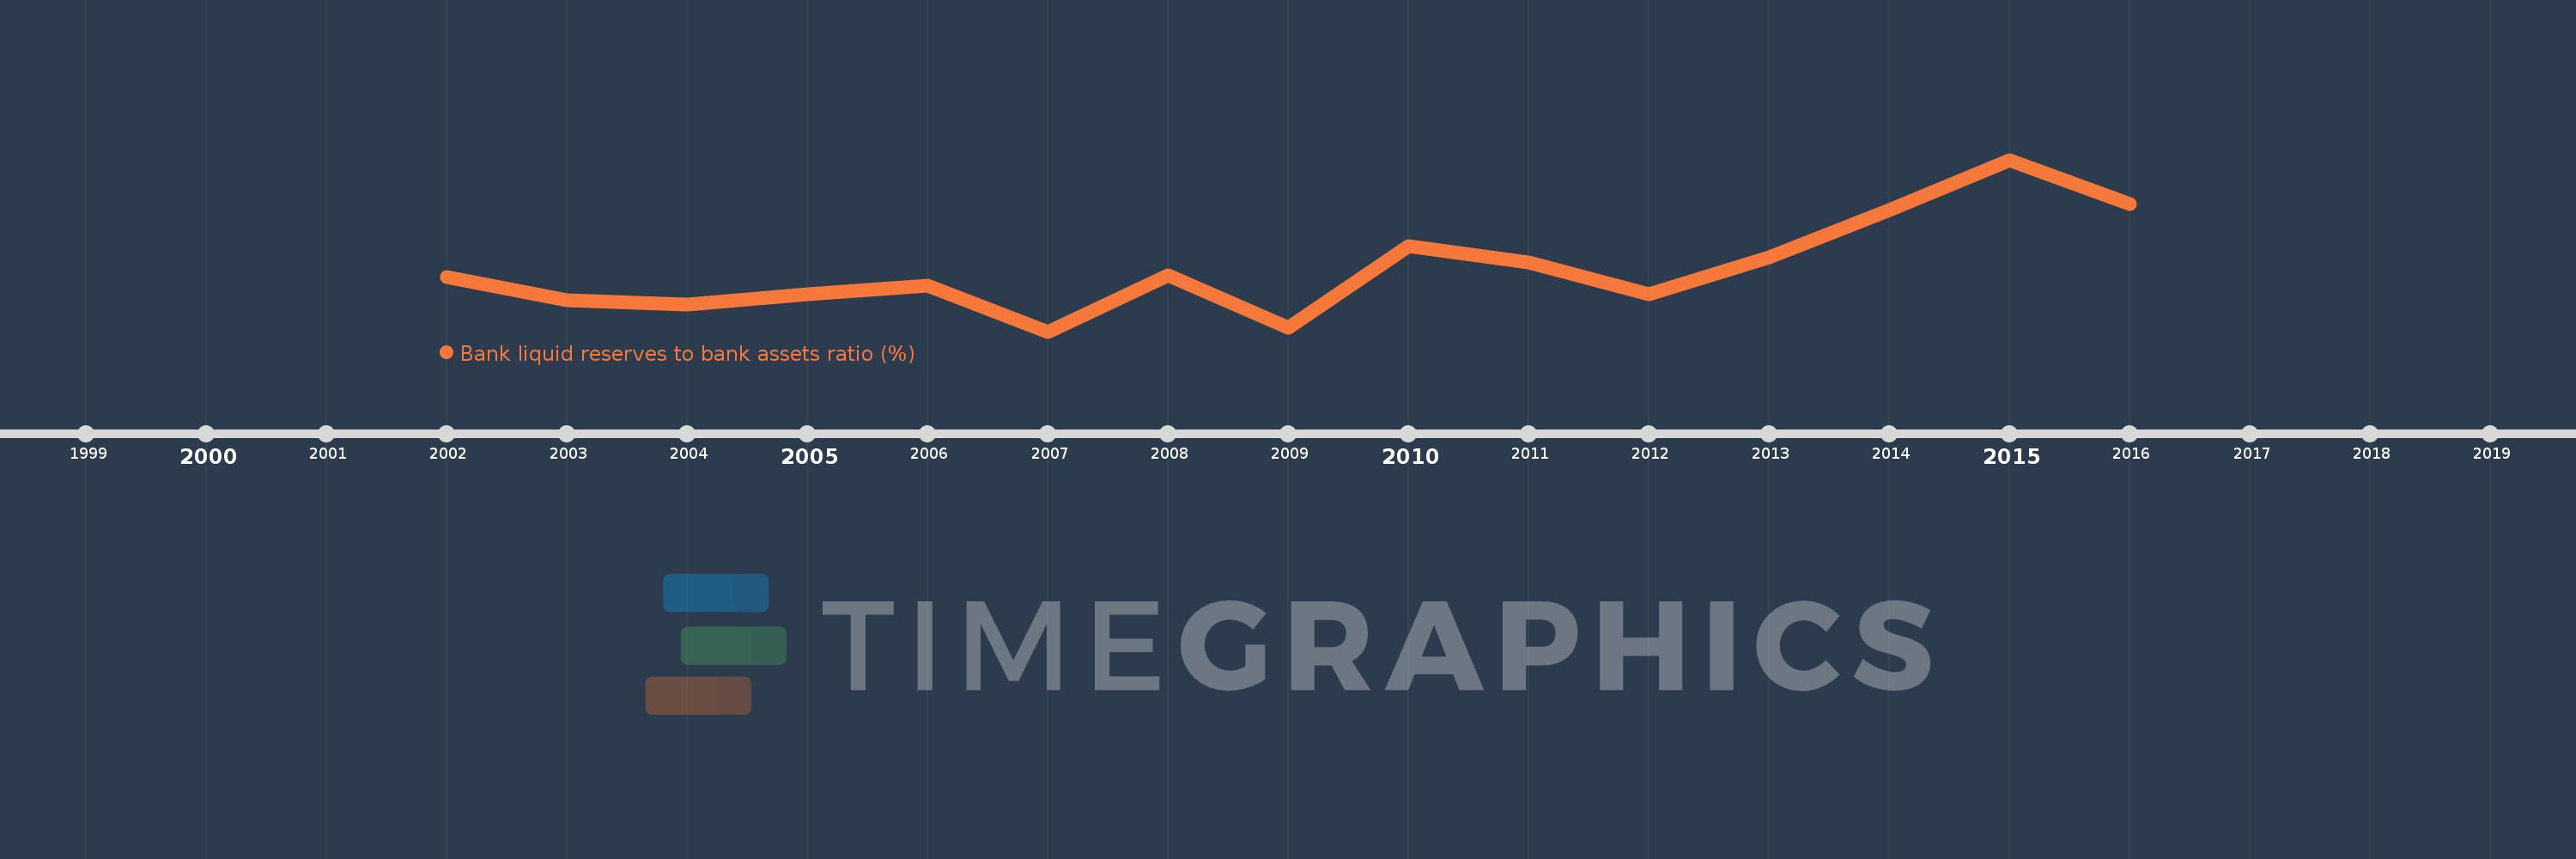
Diese Zeitleiste vorliegt die Graphik ab 2002 J. bis 2016 J. IDA blend. Die Angaben bis 2001 J. sind nicht vorhanden. Die Zahl aktueller Beobachtungen nach Daten: 15.

Die Quelle (Bezeichnung):

Kennzahlen der Weltentwicklung

Die Quelle (Einrichtung):

International Monetary Fund, International Financial Statistics and data files.

Kategorien:

Financial Sector

Es wurde aktualisiert:

23 Apr 2017 Jahr

Kennzahlen der Wertänderungen vom Jahr zum Jahr

im Durchschnitt:
18.041
Minimum:
12.994
1 Jan 2007 Jahr
Maximum:
26.759
1 Jan 2015 Jahr
Zum Datum der Beobachtung
Wert
Absolute Veränderung
Die Veränderung bezüglich dem vorherigen Wert
1 Jan 2002 Jahr
17.349
+17.349
0.0%
1 Jan 2003 Jahr
15.514
-1.835
-10.58%
1 Jan 2004 Jahr
15.167
-0.347
-2.23%
1 Jan 2005 Jahr
15.991
+0.824
5.43%
1 Jan 2006 Jahr
16.704
+0.713
4.46%
1 Jan 2007 Jahr
12.994
-3.71
-22.21%
1 Jan 2008 Jahr
17.53
+4.536
34.91%
1 Jan 2009 Jahr
13.301
-4.229
-24.13%
1 Jan 2010 Jahr
19.854
+6.553
49.27%
1 Jan 2011 Jahr
18.527
-1.327
-6.68%
1 Jan 2012 Jahr
15.98
-2.547
-13.75%
1 Jan 2013 Jahr
18.961
+2.98
18.65%
1 Jan 2014 Jahr
22.744
+3.783
19.95%
1 Jan 2015 Jahr
26.759
+4.015
17.65%
1 Jan 2016 Jahr
23.24
-3.519
-13.15%

Bewertung der Länder gemäß mit laufender Statistik nach Jahren