33
/de/
AIzaSyAYiBZKx7MnpbEhh9jyipgxe19OcubqV5w
August 1, 2025
251655
St. Vincent and the Grenadines
VCT
true
2
1
Bank liquid reserves to bank assets ratio (%)
2016,2015,2014,2013,2012,2011,2010,2009,2008,2007,2006,2005,2004,2003,2002
Download
Bibliothek der Globalstatistik →St. Vincent and the Grenadines →

Bank liquid reserves to bank assets ratio (%)

Diese Statistik in anderen Ländern:

AfghanistanAlbaniaAlgeriaAngolaAntigua and BarbudaArab WorldArmeniaAustraliaAzerbaijanBangladeshBarbadosBelarusBelizeBeninBhutanBoliviaBosnia and HerzegovinaBotswanaBrazilBrunei DarussalamBulgariaBurkina FasoBurundiCabo VerdeCambodiaCameroonCanadaCaribbean small statesCentral African RepublicCentral Europe and the BalticsChadChileColombiaComorosCongo, Dem. Rep.Congo, Rep.Costa RicaCote d'IvoireCroatiaCzech RepublicDenmarkDominicaDominican RepublicEarly-demographic dividendEast Asia & Pacific (excluding high income)East Asia & Pacific (IDA & IBRD countries)Egypt, Arab Rep.Equatorial GuineaEritreaEurope & Central Asia (excluding high income)Europe & Central Asia (IDA & IBRD countries)FijiFragile and conflict affected situationsGabonGambia, TheGeorgiaGhanaGrenadaGuatemalaGuinea-BissauGuyanaHaitiHeavily indebted poor countries (HIPC)HondurasHungaryIBRD onlyIcelandIDA & IBRD totalIDA blendIDA onlyIDA totalIndonesiaIraqIsraelJamaicaJapanKazakhstanKenyaKorea, Rep.KosovoKuwaitKyrgyz RepublicLate-demographic dividendLatin America & Caribbean Latin America & Caribbean (excluding high income)Latin America & the Caribbean (IDA & IBRD countries)Least developed countries: UN classificationLesothoLow & middle incomeLow incomeLower middle incomeMacao SAR, ChinaMacedonia, FYRMalaysiaMaldivesMaliMauritiusMexicoMiddle incomeMoldovaMongoliaMoroccoMozambiqueMyanmarNamibiaNepalNicaraguaNigerNigeriaNorwayOmanOther small statesPakistanPanamaPapua New GuineaParaguayPhilippinesPolandPre-demographic dividendQatarRomaniaRussian FederationRwandaSamoaSao Tome and PrincipeSenegalSerbiaSeychellesSierra LeoneSmall statesSolomon IslandsSouth AfricaSouth AsiaSouth Asia (IDA & IBRD)South SudanSri LankaSt. Kitts and NevisSt. LuciaSt. Vincent and the GrenadinesSub-Saharan Africa Sub-Saharan Africa (excluding high income)Sub-Saharan Africa (IDA & IBRD countries)SudanSurinameSwazilandSwedenSyrian Arab RepublicTajikistanTanzaniaThailandTogoTongaTrinidad and TobagoTurkeyUgandaUkraineUnited Arab EmiratesUpper middle incomeUruguayVanuatuVenezuela, RBWorldZambia

Zeitlinie:

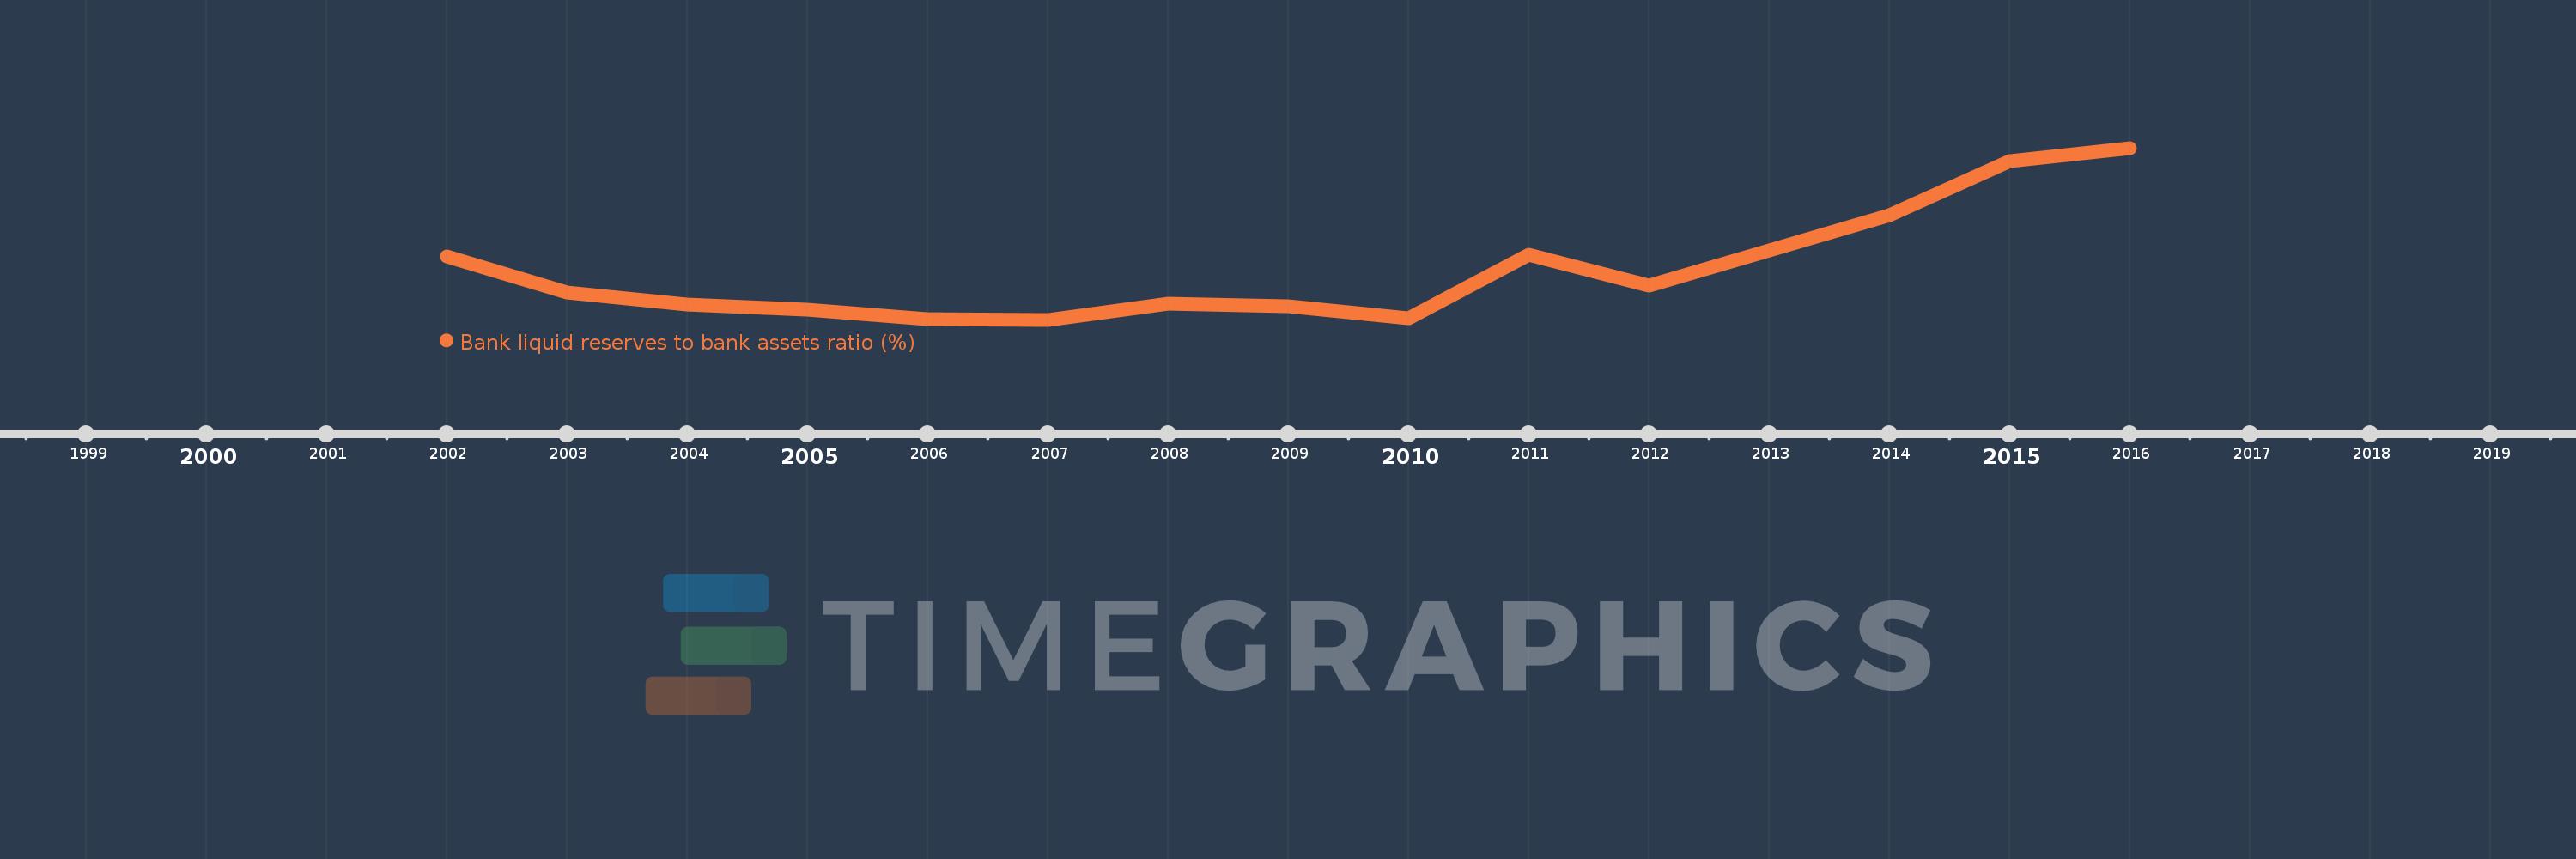
Diese Zeitleiste vorliegt die Graphik ab 2002 J. bis 2016 J. St. Vincent and the Grenadines. Die Angaben bis 2001 J. sind nicht vorhanden. Die Zahl aktueller Beobachtungen nach Daten: 15.

Die Quelle (Bezeichnung):

Kennzahlen der Weltentwicklung

Die Quelle (Einrichtung):

International Monetary Fund, International Financial Statistics and data files.

Kategorien:

Financial Sector

Es wurde aktualisiert:

23 Apr 2017 Jahr

Kennzahlen der Wertänderungen vom Jahr zum Jahr

im Durchschnitt:
13.551
Minimum:
7.886
1 Jan 2007 Jahr
Maximum:
27.325
1 Jan 2016 Jahr
Zum Datum der Beobachtung
Wert
Absolute Veränderung
Die Veränderung bezüglich dem vorherigen Wert
1 Jan 2002 Jahr
15.053
+15.053
0.0%
1 Jan 2003 Jahr
10.962
-4.091
-27.18%
1 Jan 2004 Jahr
9.586
-1.376
-12.55%
1 Jan 2005 Jahr
8.979
-0.607
-6.33%
1 Jan 2006 Jahr
7.956
-1.023
-11.39%
1 Jan 2007 Jahr
7.886
-0.07
-0.88%
1 Jan 2008 Jahr
9.667
+1.781
22.59%
1 Jan 2009 Jahr
9.441
-0.226
-2.34%
1 Jan 2010 Jahr
8.007
-1.434
-15.19%
1 Jan 2011 Jahr
15.281
+7.273
90.84%
1 Jan 2012 Jahr
11.789
-3.492
-22.85%
1 Jan 2013 Jahr
15.705
+3.916
33.22%
1 Jan 2014 Jahr
19.756
+4.051
25.79%
1 Jan 2015 Jahr
25.878
+6.122
30.99%
1 Jan 2016 Jahr
27.325
+1.447
5.59%

Bewertung der Länder gemäß mit laufender Statistik nach Jahren