30
/de/
AIzaSyAYiBZKx7MnpbEhh9jyipgxe19OcubqV5w
April 1, 2024
33687
European Union
EUU
false
2
1
Net bilateral aid flows from DAC donors, Luxembourg (current US$)
2009,2008,2006,2005,2004,2003,2002,2001,2000,1999,1998,1997,1996,1994,1993
Download
Bibliothek der Globalstatistik →European Union →

Net bilateral aid flows from DAC donors, Luxembourg (current US$)

Diese Statistik in anderen Ländern:

AfghanistanAlbaniaAlgeriaAngolaArab WorldArgentinaArmeniaAzerbaijanBangladeshBelarusBelizeBeninBhutanBoliviaBosnia and HerzegovinaBotswanaBrazilBulgariaBurkina FasoBurundiCabo VerdeCambodiaCameroonCaribbean small statesCentral African RepublicCentral Europe and the BalticsChadChileChinaColombiaComorosCongo, Dem. Rep.Congo, Rep.Costa RicaCote d'IvoireCroatiaCubaCzech RepublicDjiboutiDominicaDominican RepublicEast Asia & PacificEast Asia & Pacific (excluding high income)East Asia & Pacific (IDA & IBRD countries)EcuadorEgypt, Arab Rep.El SalvadorEquatorial GuineaEritreaEstoniaEthiopiaEuro areaEurope & Central AsiaEurope & Central Asia (excluding high income)Europe & Central Asia (IDA & IBRD countries)European UnionFijiFragile and conflict affected situationsGabonGambia, TheGeorgiaGhanaGrenadaGuatemalaGuineaGuinea-BissauGuyanaHaitiHeavily indebted poor countries (HIPC)High incomeHondurasHungaryIBRD onlyIDA & IBRD totalIDA blendIDA onlyIDA totalIndiaIndonesiaIran, Islamic Rep.IraqIsraelJamaicaJordanKazakhstanKenyaKorea, Dem. People’s Rep.Korea, Rep.KosovoKyrgyz RepublicLao PDRLatin America & Caribbean Latin America & Caribbean (excluding high income)Latin America & the Caribbean (IDA & IBRD countries)LatviaLeast developed countries: UN classificationLebanonLesothoLiberiaLibyaLithuaniaLow & middle incomeLow incomeLower middle incomeMacedonia, FYRMadagascarMalawiMalaysiaMaldivesMaliMauritaniaMauritiusMexicoMicronesia, Fed. Sts.Middle East & North AfricaMiddle East & North Africa (excluding high income)Middle East & North Africa (IDA & IBRD countries)Middle incomeMoldovaMongoliaMontenegroMoroccoMozambiqueMyanmarNamibiaNepalNicaraguaNigerNigeriaOECD membersOther small statesPacific island small statesPakistanPalauPanamaParaguayPeruPhilippinesPolandRomaniaRussian FederationRwandaSamoaSao Tome and PrincipeSenegalSerbiaSierra LeoneSlovak RepublicSloveniaSmall statesSomaliaSouth AfricaSouth AsiaSouth Asia (IDA & IBRD)South SudanSri LankaSt. LuciaSub-Saharan Africa Sub-Saharan Africa (excluding high income)Sub-Saharan Africa (IDA & IBRD countries)SudanSwazilandSyrian Arab RepublicTajikistanTanzaniaThailandTimor-LesteTogoTunisiaTurkeyTurkmenistanUgandaUkraineUpper middle incomeUruguayUzbekistanVanuatuVenezuela, RBVietnamWest Bank and GazaWorldYemen, Rep.ZambiaZimbabwe

Zeitlinie:

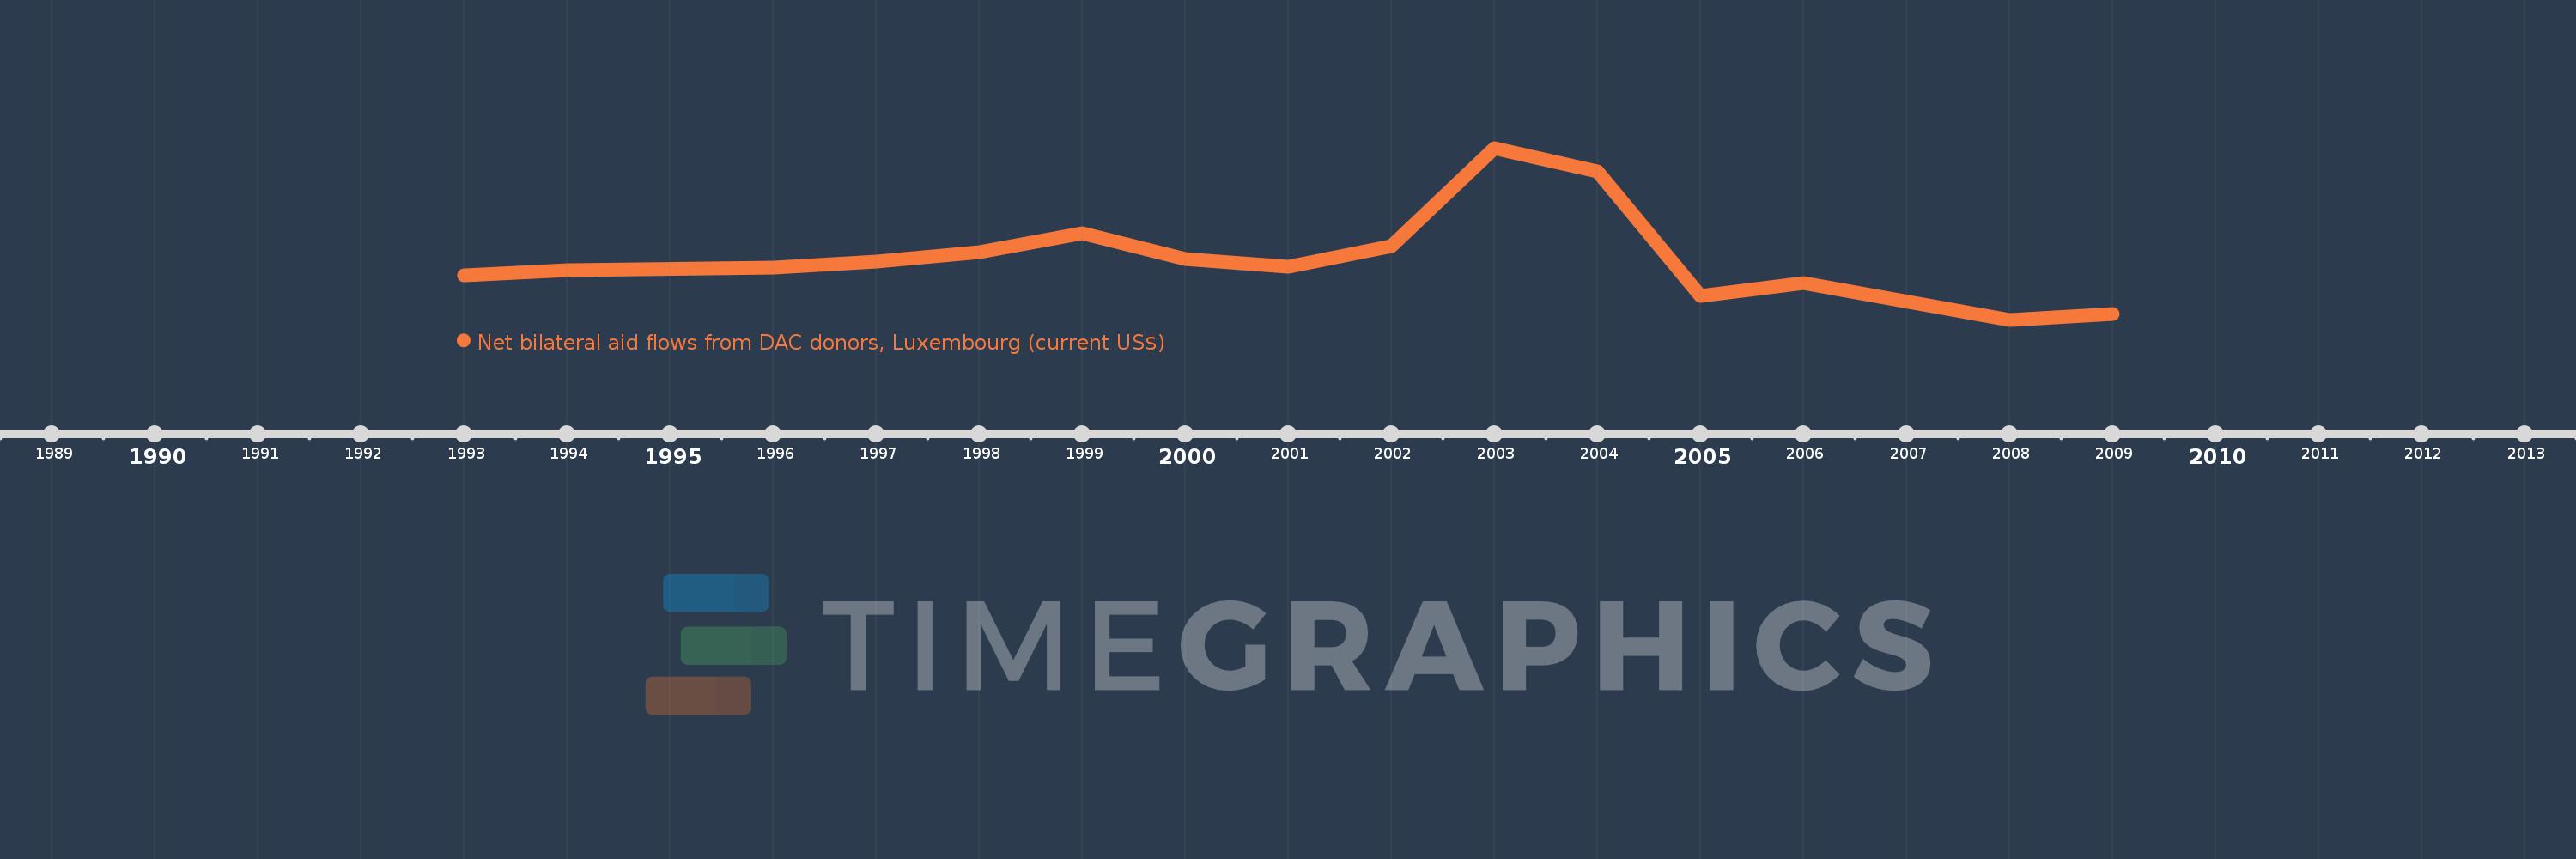
Diese Zeitleiste vorliegt die Graphik ab 1993 J. bis 2009 J. European Union. Die Angaben bis 1992 J. sind nicht vorhanden. Die Zahl aktueller Beobachtungen nach Daten: 15.

Die Quelle (Bezeichnung):

Kennzahlen der Weltentwicklung

Die Quelle (Einrichtung):

Development Assistance Committee of the Organisation for Economic Co-operation and Development, Geographical Distribution of Financial Flows to Developing Countries, Development Co-operation Report, and International Development Statistics database. Data are available online at: www.oecd.org/dac/stats/idsonline.

Kategorien:

Aid Effectiveness

Es wurde aktualisiert:

23 Apr 2017 Jahr

Kennzahlen der Wertänderungen vom Jahr zum Jahr

im Durchschnitt:
810.0 Tsnd.
Minimum:
40.0 Tsnd.
1 Jan 2008 Jahr
Maximum:
2.17 Mln.
1 Jan 2003 Jahr
Zum Datum der Beobachtung
Wert
Absolute Veränderung
Die Veränderung bezüglich dem vorherigen Wert
1 Jan 1993 Jahr
590.0 Tsnd.
+590.0 Tsnd.
0.0%
1 Jan 1994 Jahr
650.0 Tsnd.
+60.0 Tsnd.
10.17%
1 Jan 1996 Jahr
690.0 Tsnd.
+40.0 Tsnd.
6.15%
1 Jan 1997 Jahr
760.0 Tsnd.
+70.0 Tsnd.
10.14%
1 Jan 1998 Jahr
880.0 Tsnd.
+120.0 Tsnd.
15.79%
1 Jan 1999 Jahr
1.11 Mln.
+230.0 Tsnd.
26.14%
1 Jan 2000 Jahr
790.0 Tsnd.
-320.0 Tsnd.
-28.83%
1 Jan 2001 Jahr
700.0 Tsnd.
-90.0 Tsnd.
-11.39%
1 Jan 2002 Jahr
950.0 Tsnd.
+250.0 Tsnd.
35.71%
1 Jan 2003 Jahr
2.17 Mln.
+1.22 Mln.
128.42%
1 Jan 2004 Jahr
1.88 Mln.
-290.0 Tsnd.
-13.36%
1 Jan 2005 Jahr
340.0 Tsnd.
-1.54 Mln.
-81.91%
1 Jan 2006 Jahr
490.0 Tsnd.
+150.0 Tsnd.
44.12%
1 Jan 2008 Jahr
40.0 Tsnd.
-450.0 Tsnd.
-91.84%
1 Jan 2009 Jahr
110.0 Tsnd.
+70.0 Tsnd.
175.0%

Bewertung der Länder gemäß mit laufender Statistik nach Jahren