33
/de/
AIzaSyAYiBZKx7MnpbEhh9jyipgxe19OcubqV5w
August 1, 2025
201921
Morocco
MAR
true
2
1
Net bilateral aid flows from DAC donors, Luxembourg (current US$)
2015,2010,2009,2008,2007,2006,2005,2004,2003,2002,2001,2000,1999,1998,1997,1996,1991
Download
Bibliothek der Globalstatistik →Morocco →

Net bilateral aid flows from DAC donors, Luxembourg (current US$)

Diese Statistik in anderen Ländern:

AfghanistanAlbaniaAlgeriaAngolaArab WorldArgentinaArmeniaAzerbaijanBangladeshBelarusBelizeBeninBhutanBoliviaBosnia and HerzegovinaBotswanaBrazilBulgariaBurkina FasoBurundiCabo VerdeCambodiaCameroonCaribbean small statesCentral African RepublicCentral Europe and the BalticsChadChileChinaColombiaComorosCongo, Dem. Rep.Congo, Rep.Costa RicaCote d'IvoireCroatiaCubaCzech RepublicDjiboutiDominicaDominican RepublicEast Asia & PacificEast Asia & Pacific (excluding high income)East Asia & Pacific (IDA & IBRD countries)EcuadorEgypt, Arab Rep.El SalvadorEquatorial GuineaEritreaEstoniaEthiopiaEuro areaEurope & Central AsiaEurope & Central Asia (excluding high income)Europe & Central Asia (IDA & IBRD countries)European UnionFijiFragile and conflict affected situationsGabonGambia, TheGeorgiaGhanaGrenadaGuatemalaGuineaGuinea-BissauGuyanaHaitiHeavily indebted poor countries (HIPC)High incomeHondurasHungaryIBRD onlyIDA & IBRD totalIDA blendIDA onlyIDA totalIndiaIndonesiaIran, Islamic Rep.IraqIsraelJamaicaJordanKazakhstanKenyaKorea, Dem. People’s Rep.Korea, Rep.KosovoKyrgyz RepublicLao PDRLatin America & Caribbean Latin America & Caribbean (excluding high income)Latin America & the Caribbean (IDA & IBRD countries)LatviaLeast developed countries: UN classificationLebanonLesothoLiberiaLibyaLithuaniaLow & middle incomeLow incomeLower middle incomeMacedonia, FYRMadagascarMalawiMalaysiaMaldivesMaliMauritaniaMauritiusMexicoMicronesia, Fed. Sts.Middle East & North AfricaMiddle East & North Africa (excluding high income)Middle East & North Africa (IDA & IBRD countries)Middle incomeMoldovaMongoliaMontenegroMoroccoMozambiqueMyanmarNamibiaNepalNicaraguaNigerNigeriaOECD membersOther small statesPacific island small statesPakistanPalauPanamaParaguayPeruPhilippinesPolandRomaniaRussian FederationRwandaSamoaSao Tome and PrincipeSenegalSerbiaSierra LeoneSlovak RepublicSloveniaSmall statesSomaliaSouth AfricaSouth AsiaSouth Asia (IDA & IBRD)South SudanSri LankaSt. LuciaSub-Saharan Africa Sub-Saharan Africa (excluding high income)Sub-Saharan Africa (IDA & IBRD countries)SudanSwazilandSyrian Arab RepublicTajikistanTanzaniaThailandTimor-LesteTogoTunisiaTurkeyTurkmenistanUgandaUkraineUpper middle incomeUruguayUzbekistanVanuatuVenezuela, RBVietnamWest Bank and GazaWorldYemen, Rep.ZambiaZimbabwe

Zeitlinie:

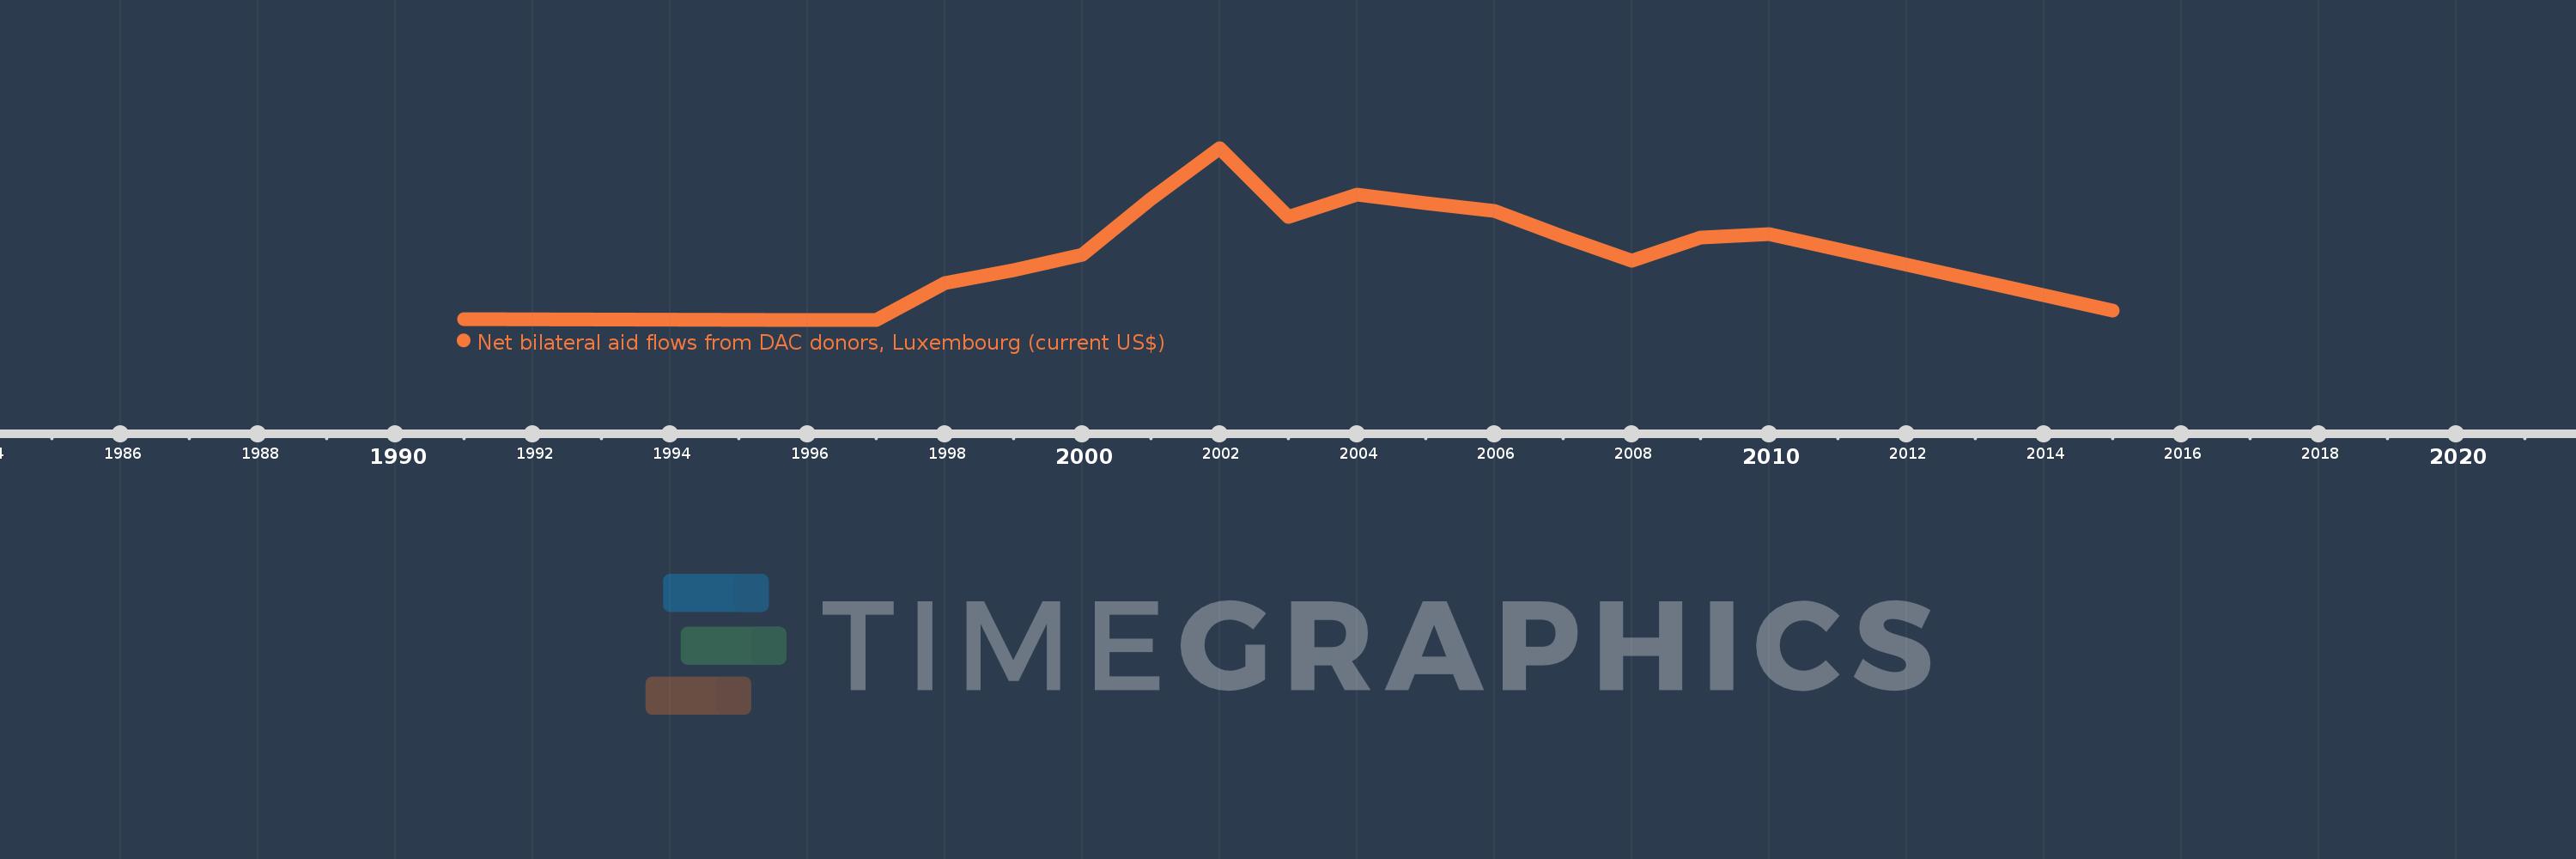
Diese Zeitleiste vorliegt die Graphik ab 1991 J. bis 2015 J. Morocco. Die Angaben bis 1990 J. sind nicht vorhanden. Die Zahl aktueller Beobachtungen nach Daten: 17.

Die Quelle (Bezeichnung):

Kennzahlen der Weltentwicklung

Die Quelle (Einrichtung):

Development Assistance Committee of the Organisation for Economic Co-operation and Development, Geographical Distribution of Financial Flows to Developing Countries, Development Co-operation Report, and International Development Statistics database. Data are available online at: www.oecd.org/dac/stats/idsonline.

Kategorien:

Aid Effectiveness

Es wurde aktualisiert:

23 Apr 2017 Jahr

Kennzahlen der Wertänderungen vom Jahr zum Jahr

im Durchschnitt:
1.166 Mln.
Minimum:
20.0 Tsnd.
1 Jan 1996 Jahr
Maximum:
2.77 Mln.
1 Jan 2002 Jahr
Zum Datum der Beobachtung
Wert
Absolute Veränderung
Die Veränderung bezüglich dem vorherigen Wert
1 Jan 1991 Jahr
30.0 Tsnd.
+30.0 Tsnd.
0.0%
1 Jan 1996 Jahr
20.0 Tsnd.
-10.0 Tsnd.
-33.33%
1 Jan 1997 Jahr
20.0 Tsnd.
0.0
0.0%
1 Jan 1998 Jahr
610.0 Tsnd.
+590.0 Tsnd.
2.95 Tsnd.%
1 Jan 1999 Jahr
810.0 Tsnd.
+200.0 Tsnd.
32.79%
1 Jan 2000 Jahr
1.06 Mln.
+250.0 Tsnd.
30.86%
1 Jan 2001 Jahr
1.95 Mln.
+890.0 Tsnd.
83.96%
1 Jan 2002 Jahr
2.77 Mln.
+820.0 Tsnd.
42.05%
1 Jan 2003 Jahr
1.66 Mln.
-1.11 Mln.
-40.07%
1 Jan 2004 Jahr
2.03 Mln.
+370.0 Tsnd.
22.29%
1 Jan 2005 Jahr
1.89 Mln.
-140.0 Tsnd.
-6.9%
1 Jan 2006 Jahr
1.76 Mln.
-130.0 Tsnd.
-6.88%
1 Jan 2007 Jahr
1.35 Mln.
-410.0 Tsnd.
-23.3%
1 Jan 2008 Jahr
970.0 Tsnd.
-380.0 Tsnd.
-28.15%
1 Jan 2009 Jahr
1.34 Mln.
+370.0 Tsnd.
38.14%
1 Jan 2010 Jahr
1.39 Mln.
+50.0 Tsnd.
3.73%
1 Jan 2015 Jahr
170.0 Tsnd.
-1.22 Mln.
-87.77%

Bewertung der Länder gemäß mit laufender Statistik nach Jahren