33
/de/
AIzaSyAYiBZKx7MnpbEhh9jyipgxe19OcubqV5w
August 1, 2025
33278
European Union
EUU
false
2
1
Claims on other sectors of the domestic economy (% of GDP)
2016,2015,2014,2013,2012,2011,2010,2009,2008,2007,2006,2005,2004,2003,2002
Download
Bibliothek der Globalstatistik →European Union →

Claims on other sectors of the domestic economy (% of GDP)

Diese Statistik in anderen Ländern:

AfghanistanAlbaniaAlgeriaAngolaAntigua and BarbudaArmeniaAustraliaAustriaAzerbaijanBangladeshBarbadosBelarusBelgiumBelizeBeninBhutanBoliviaBosnia and HerzegovinaBotswanaBrazilBrunei DarussalamBulgariaBurkina FasoBurundiCabo VerdeCambodiaCameroonCanadaCaribbean small statesCentral African RepublicCentral Europe and the BalticsChadChileColombiaComorosCongo, Dem. Rep.Congo, Rep.Costa RicaCote d'IvoireCroatiaCyprusCzech RepublicDenmarkDominicaDominican RepublicEast Asia & PacificEcuadorEgypt, Arab Rep.El SalvadorEquatorial GuineaEritreaEstoniaEuro areaEurope & Central AsiaEurope & Central Asia (excluding high income)Europe & Central Asia (IDA & IBRD countries)European UnionFijiFinlandFragile and conflict affected situationsFranceGabonGambia, TheGeorgiaGermanyGhanaGreeceGrenadaGuatemalaGuinea-BissauGuyanaHaitiHeavily indebted poor countries (HIPC)High incomeHondurasHungaryIcelandIDA blendIDA onlyIDA totalIndonesiaIraqIrelandIsraelItalyJamaicaJapanKazakhstanKenyaKorea, Rep.KosovoKuwaitKyrgyz RepublicLatin America & Caribbean Latin America & Caribbean (excluding high income)Latin America & the Caribbean (IDA & IBRD countries)LatviaLeast developed countries: UN classificationLesothoLithuaniaLow incomeLuxembourgMacao SAR, ChinaMacedonia, FYRMalaysiaMaldivesMaliMaltaMauritiusMexicoMiddle East & North AfricaMiddle East & North Africa (excluding high income)Middle East & North Africa (IDA & IBRD countries)MoldovaMongoliaMoroccoMozambiqueMyanmarNamibiaNepalNetherlandsNicaraguaNigerNigeriaNorth AmericaNorwayOECD membersOmanOther small statesPacific island small statesPakistanPanamaPapua New GuineaParaguayPhilippinesPolandPortugalPost-demographic dividendPre-demographic dividendQatarRomaniaRussian FederationRwandaSamoaSao Tome and PrincipeSenegalSerbiaSeychellesSierra LeoneSlovak RepublicSloveniaSmall statesSolomon IslandsSouth AfricaSouth SudanSpainSri LankaSt. Kitts and NevisSt. LuciaSt. Vincent and the GrenadinesSub-Saharan Africa Sub-Saharan Africa (excluding high income)Sub-Saharan Africa (IDA & IBRD countries)SudanSurinameSwazilandSwedenSyrian Arab RepublicTajikistanTanzaniaThailandTimor-LesteTogoTongaTrinidad and TobagoTurkeyUgandaUkraineUnited Arab EmiratesUnited StatesUruguayVanuatuVenezuela, RBWest Bank and GazaWorldZambia

Zeitlinie:

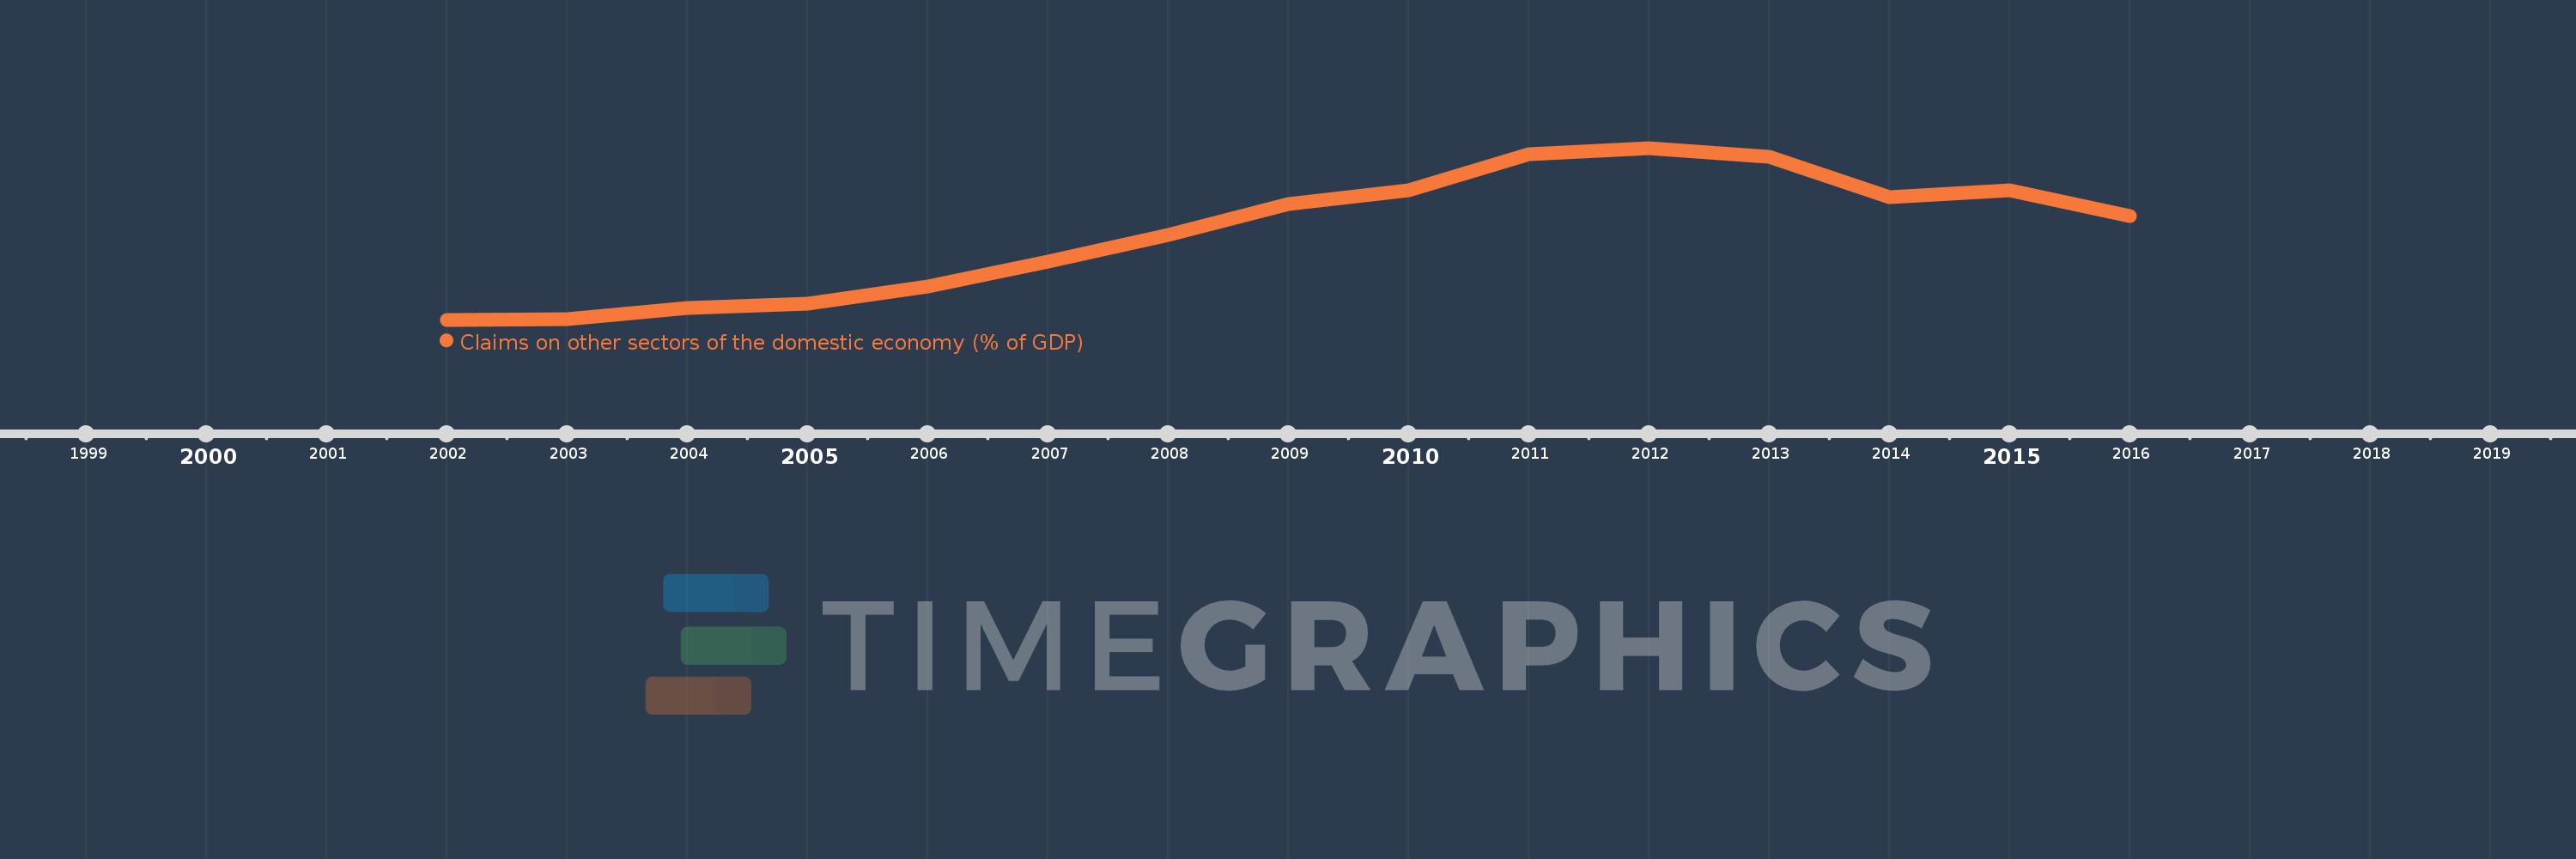
Diese Zeitleiste vorliegt die Graphik ab 2002 J. bis 2016 J. European Union. Die Angaben bis 2001 J. sind nicht vorhanden. Die Zahl aktueller Beobachtungen nach Daten: 15.

Die Quelle (Bezeichnung):

Kennzahlen der Weltentwicklung

Die Quelle (Einrichtung):

International Monetary Fund, International Financial Statistics and data files, and World Bank and OECD GDP estimates.

Kategorien:

Financial Sector

Es wurde aktualisiert:

23 Apr 2017 Jahr

Kennzahlen der Wertänderungen vom Jahr zum Jahr

im Durchschnitt:
129.115
Minimum:
103.278
1 Jan 2002 Jahr
Maximum:
154.262
1 Jan 2012 Jahr
Zum Datum der Beobachtung
Wert
Absolute Veränderung
Die Veränderung bezüglich dem vorherigen Wert
1 Jan 2002 Jahr
103.278
+103.278
0.0%
1 Jan 2003 Jahr
103.549
+0.271
0.26%
1 Jan 2004 Jahr
106.774
+3.225
3.11%
1 Jan 2005 Jahr
108.021
+1.247
1.17%
1 Jan 2006 Jahr
113.129
+5.108
4.73%
1 Jan 2007 Jahr
120.536
+7.408
6.55%
1 Jan 2008 Jahr
128.543
+8.007
6.64%
1 Jan 2009 Jahr
137.525
+8.982
6.99%
1 Jan 2010 Jahr
141.786
+4.261
3.1%
1 Jan 2011 Jahr
152.388
+10.602
7.48%
1 Jan 2012 Jahr
154.262
+1.874
1.23%
1 Jan 2013 Jahr
151.589
-2.673
-1.73%
1 Jan 2014 Jahr
139.531
-12.057
-7.95%
1 Jan 2015 Jahr
141.807
+2.275
1.63%
1 Jan 2016 Jahr
134.006
-7.801
-5.5%

Bewertung der Länder gemäß mit laufender Statistik nach Jahren