30
/de/
AIzaSyAYiBZKx7MnpbEhh9jyipgxe19OcubqV5w
April 1, 2024
218068
Panama
PAN
true
2
1
Claims on other sectors of the domestic economy (% of GDP)
2016,2015,2014,2013,2012,2011,2010,2009,2008,2007,2006,2005,2004,2003,2002
Download
Bibliothek der Globalstatistik →Panama →

Claims on other sectors of the domestic economy (% of GDP)

Diese Statistik in anderen Ländern:

AfghanistanAlbaniaAlgeriaAngolaAntigua and BarbudaArmeniaAustraliaAustriaAzerbaijanBangladeshBarbadosBelarusBelgiumBelizeBeninBhutanBoliviaBosnia and HerzegovinaBotswanaBrazilBrunei DarussalamBulgariaBurkina FasoBurundiCabo VerdeCambodiaCameroonCanadaCaribbean small statesCentral African RepublicCentral Europe and the BalticsChadChileColombiaComorosCongo, Dem. Rep.Congo, Rep.Costa RicaCote d'IvoireCroatiaCyprusCzech RepublicDenmarkDominicaDominican RepublicEast Asia & PacificEcuadorEgypt, Arab Rep.El SalvadorEquatorial GuineaEritreaEstoniaEuro areaEurope & Central AsiaEurope & Central Asia (excluding high income)Europe & Central Asia (IDA & IBRD countries)European UnionFijiFinlandFragile and conflict affected situationsFranceGabonGambia, TheGeorgiaGermanyGhanaGreeceGrenadaGuatemalaGuinea-BissauGuyanaHaitiHeavily indebted poor countries (HIPC)High incomeHondurasHungaryIcelandIDA blendIDA onlyIDA totalIndonesiaIraqIrelandIsraelItalyJamaicaJapanKazakhstanKenyaKorea, Rep.KosovoKuwaitKyrgyz RepublicLatin America & Caribbean Latin America & Caribbean (excluding high income)Latin America & the Caribbean (IDA & IBRD countries)LatviaLeast developed countries: UN classificationLesothoLithuaniaLow incomeLuxembourgMacao SAR, ChinaMacedonia, FYRMalaysiaMaldivesMaliMaltaMauritiusMexicoMiddle East & North AfricaMiddle East & North Africa (excluding high income)Middle East & North Africa (IDA & IBRD countries)MoldovaMongoliaMoroccoMozambiqueMyanmarNamibiaNepalNetherlandsNicaraguaNigerNigeriaNorth AmericaNorwayOECD membersOmanOther small statesPacific island small statesPakistanPanamaPapua New GuineaParaguayPhilippinesPolandPortugalPost-demographic dividendPre-demographic dividendQatarRomaniaRussian FederationRwandaSamoaSao Tome and PrincipeSenegalSerbiaSeychellesSierra LeoneSlovak RepublicSloveniaSmall statesSolomon IslandsSouth AfricaSouth SudanSpainSri LankaSt. Kitts and NevisSt. LuciaSt. Vincent and the GrenadinesSub-Saharan Africa Sub-Saharan Africa (excluding high income)Sub-Saharan Africa (IDA & IBRD countries)SudanSurinameSwazilandSwedenSyrian Arab RepublicTajikistanTanzaniaThailandTimor-LesteTogoTongaTrinidad and TobagoTurkeyUgandaUkraineUnited Arab EmiratesUnited StatesUruguayVanuatuVenezuela, RBWest Bank and GazaWorldZambia

Zeitlinie:

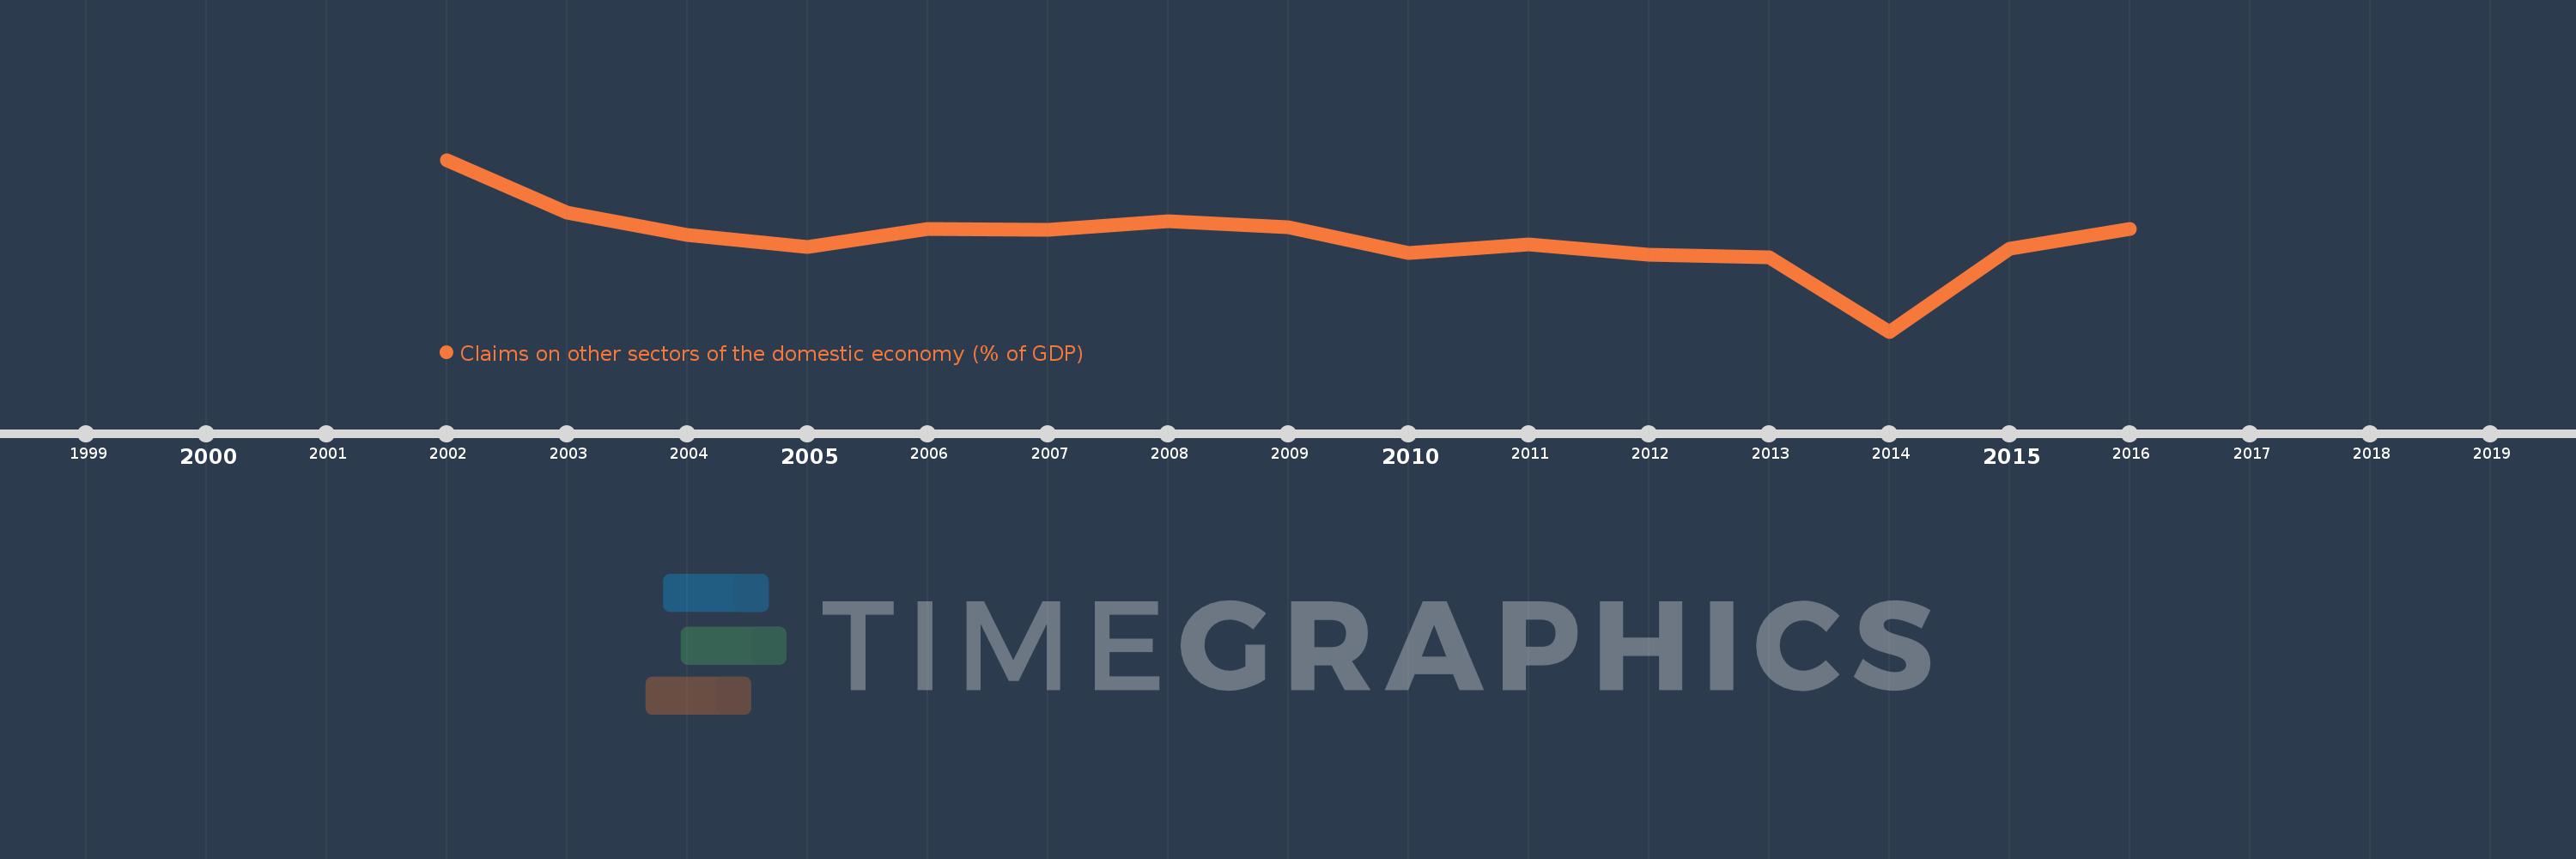
Diese Zeitleiste vorliegt die Graphik ab 2002 J. bis 2016 J. Panama. Die Angaben bis 2001 J. sind nicht vorhanden. Die Zahl aktueller Beobachtungen nach Daten: 15.

Die Quelle (Bezeichnung):

Kennzahlen der Weltentwicklung

Die Quelle (Einrichtung):

International Monetary Fund, International Financial Statistics and data files, and World Bank and OECD GDP estimates.

Kategorien:

Financial Sector

Es wurde aktualisiert:

23 Apr 2017 Jahr

Kennzahlen der Wertänderungen vom Jahr zum Jahr

im Durchschnitt:
86.919
Minimum:
68.551
1 Jan 2014 Jahr
Maximum:
102.534
1 Jan 2002 Jahr
Zum Datum der Beobachtung
Wert
Absolute Veränderung
Die Veränderung bezüglich dem vorherigen Wert
1 Jan 2002 Jahr
102.534
+102.534
0.0%
1 Jan 2003 Jahr
92.082
-10.452
-10.19%
1 Jan 2004 Jahr
87.622
-4.459
-4.84%
1 Jan 2005 Jahr
85.333
-2.289
-2.61%
1 Jan 2006 Jahr
88.775
+3.442
4.03%
1 Jan 2007 Jahr
88.639
-0.135
-0.15%
1 Jan 2008 Jahr
90.38
+1.74
1.96%
1 Jan 2009 Jahr
89.215
-1.165
-1.29%
1 Jan 2010 Jahr
84.098
-5.117
-5.74%
1 Jan 2011 Jahr
85.837
+1.739
2.07%
1 Jan 2012 Jahr
83.79
-2.047
-2.38%
1 Jan 2013 Jahr
83.167
-0.622
-0.74%
1 Jan 2014 Jahr
68.551
-14.617
-17.57%
1 Jan 2015 Jahr
84.895
+16.344
23.84%
1 Jan 2016 Jahr
88.865
+3.97
4.68%

Bewertung der Länder gemäß mit laufender Statistik nach Jahren