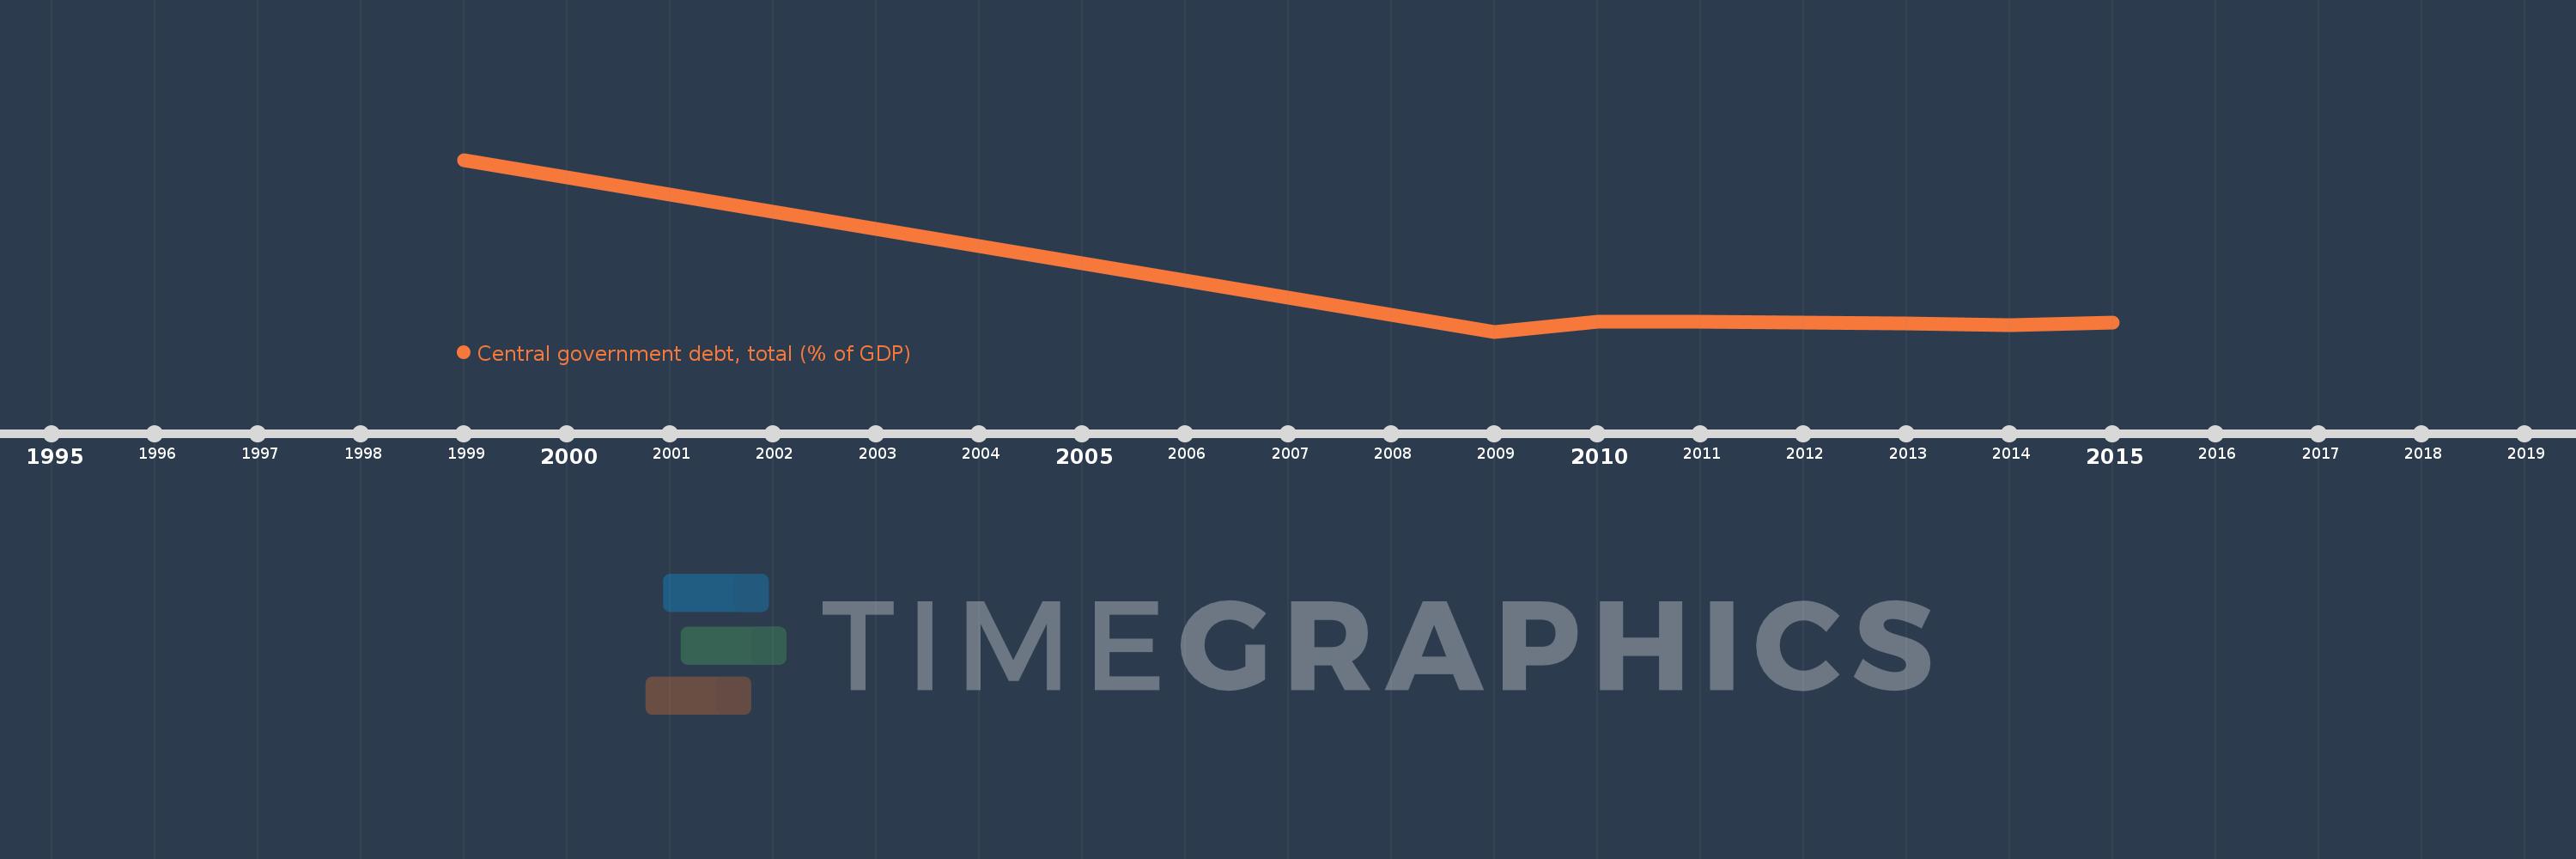
Diese Zeitleiste vorliegt die Graphik ab 1999 J. bis 2015 J. Europe & Central Asia (excluding high income). Die Angaben bis 1998 J. sind nicht vorhanden. Die Zahl aktueller Beobachtungen nach Daten: 8.
Die Quelle (Bezeichnung):
Kennzahlen der Weltentwicklung
Die Quelle (Einrichtung):
International Monetary Fund, Government Finance Statistics Yearbook and data files, and World Bank and OECD GDP estimates.
Kategorien:
Economy & Growth, Public Sector
Es wurde aktualisiert:
23 Apr 2017 Jahr
Kennzahlen der Wertänderungen vom Jahr zum Jahr
im Durchschnitt:
32.008
Minimum:
18.169
1 Jan 2009 Jahr
Maximum:
103.272
1 Jan 1999 Jahr
Zum Datum der Beobachtung
Wert
Absolute Veränderung
Die Veränderung bezüglich dem vorherigen Wert
1 Jan 1999 Jahr
103.272
+103.272
0.0%
1 Jan 2009 Jahr
18.169
-85.103
-82.41%
1 Jan 2010 Jahr
23.021
+4.853
26.71%
1 Jan 2011 Jahr
22.906
-0.116
-0.5%
1 Jan 2012 Jahr
22.477
-0.429
-1.87%
1 Jan 2013 Jahr
22.263
-0.214
-0.95%
1 Jan 2014 Jahr
21.461
-0.802
-3.6%
1 Jan 2015 Jahr
22.499
+1.038
4.83%
Bewertung der Länder gemäß mit laufender Statistik nach Jahren