Download Diese Statistik in anderen Ländern:
Zeitlinie:
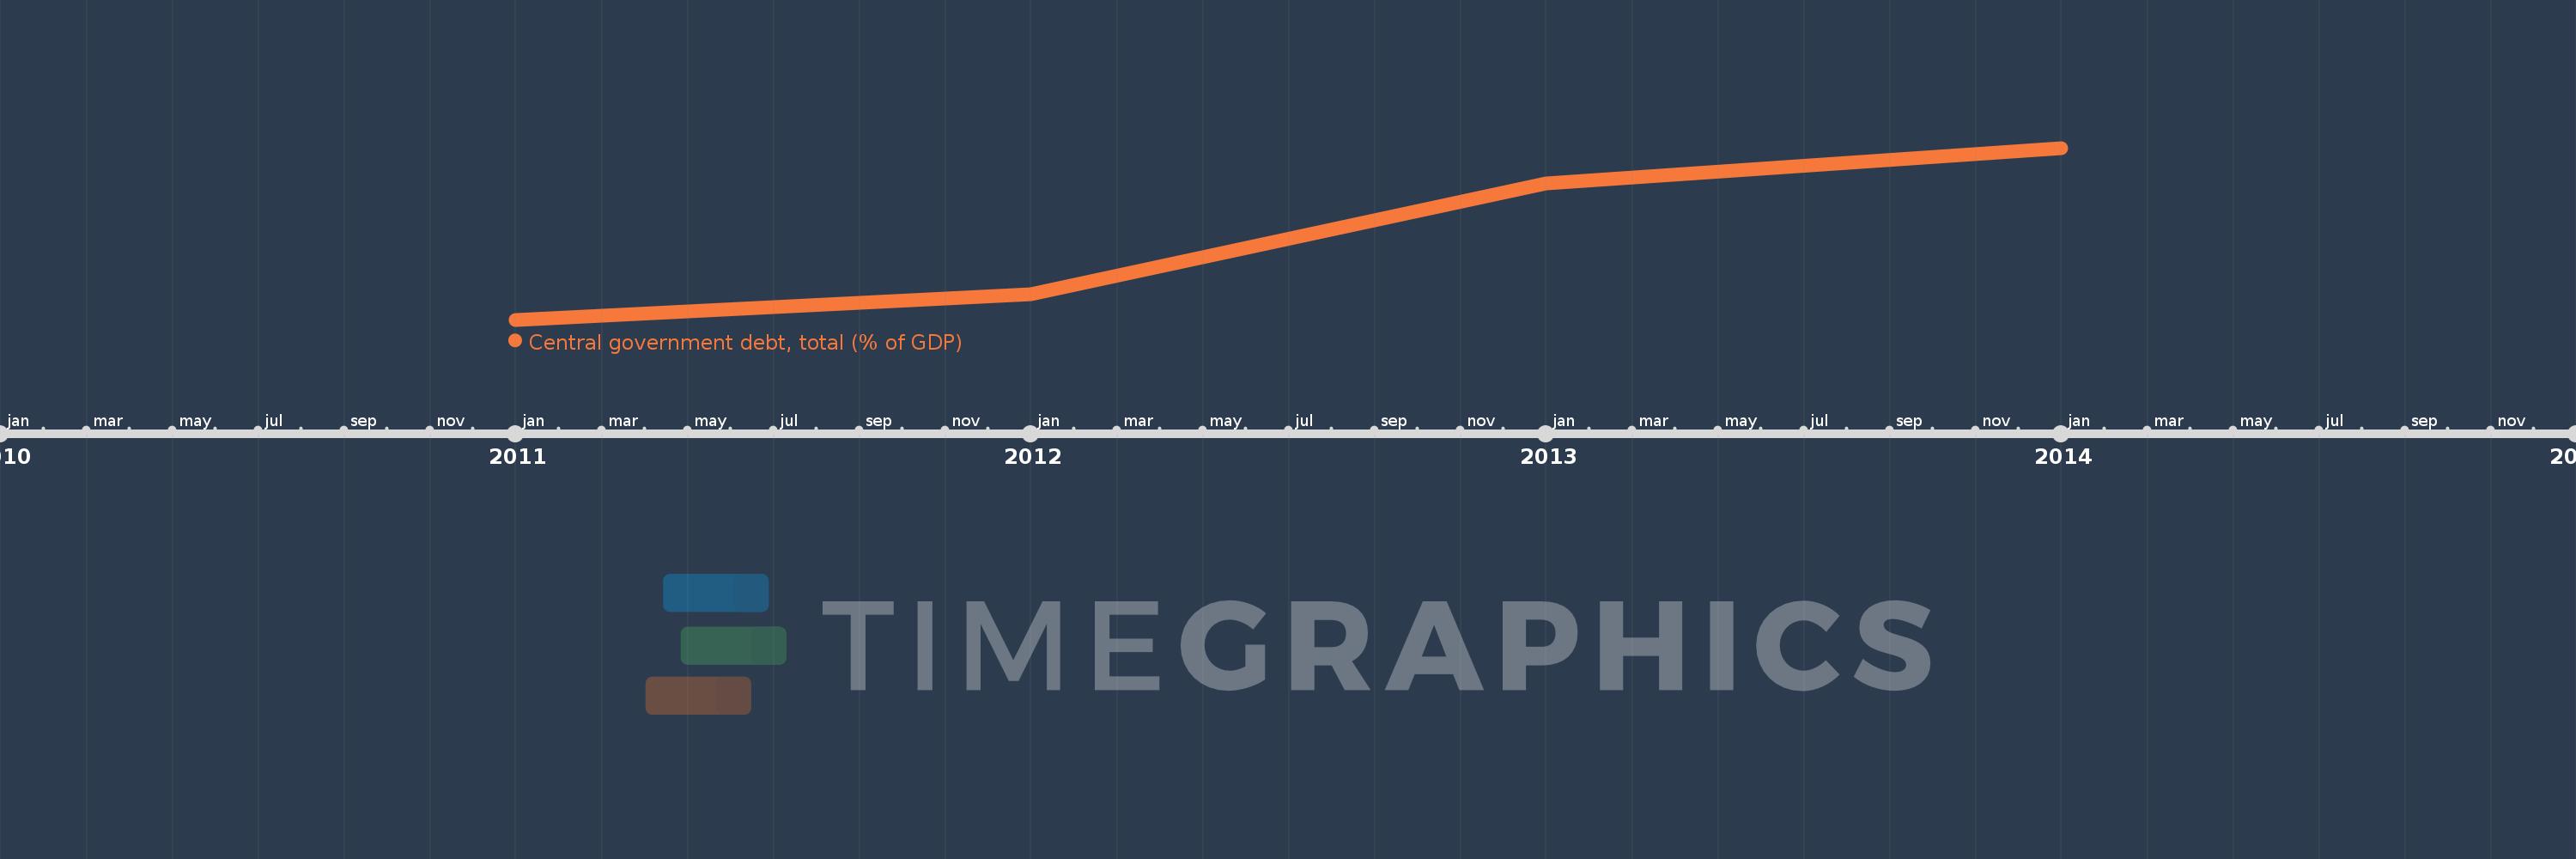
Diese Zeitleiste vorliegt die Graphik ab 2011 J. bis 2014 J. Europe & Central Asia. Die Angaben bis 2010 J. sind nicht vorhanden. Die Zahl aktueller Beobachtungen nach Daten: 4.
Die Quelle (Bezeichnung):
Kennzahlen der Weltentwicklung
Die Quelle (Einrichtung):
International Monetary Fund, Government Finance Statistics Yearbook and data files, and World Bank and OECD GDP estimates.
Kategorien:
Economy & Growth, Public Sector
Es wurde aktualisiert:
23 Apr 2017 Jahr
Kennzahlen der Wertänderungen vom Jahr zum Jahr
Minimum:
62.272
1 Jan 2011 Jahr
Maximum:
75.967
1 Jan 2014 Jahr
Zum Datum der Beobachtung
Wert
Absolute Veränderung
Die Veränderung bezüglich dem vorherigen Wert
1 Jan 2011 Jahr
62.272
+62.272
0.0%
1 Jan 2012 Jahr
64.309
+2.037
3.27%
1 Jan 2013 Jahr
73.166
+8.857
13.77%
1 Jan 2014 Jahr
75.967
+2.801
3.83%
Bewertung der Länder gemäß mit laufender Statistik nach Jahren