29
/de/
de
AIzaSyAYiBZKx7MnpbEhh9jyipgxe19OcubqV5w
April 1, 2024
281162
Venezuela, RB
VEN
true
2
1
International tourism, expenditures (% of total imports)
2014,2013,2012,2011,2010,2009,2008,2007,2006,2005,2004,2003,2002,2001,2000,1999,1998,1997,1996
Download
Bibliothek der Globalstatistik →Venezuela, RB →

International tourism, expenditures (% of total imports)

Diese Statistik in anderen Ländern:
AfghanistanAlbaniaAlgeriaAngolaAntigua and BarbudaArab WorldArgentinaArmeniaArubaAustraliaAustriaAzerbaijanBahamas, TheBahrainBangladeshBarbadosBelarusBelgiumBelizeBeninBermudaBhutanBoliviaBosnia and HerzegovinaBotswanaBrazilBrunei DarussalamBulgariaBurkina FasoBurundiCabo VerdeCambodiaCameroonCanadaCaribbean small statesCentral Europe and the BalticsChileChinaColombiaComorosCongo, Dem. Rep.Congo, Rep.Costa RicaCote d'IvoireCroatiaCuracaoCyprusCzech RepublicDenmarkDjiboutiDominicaDominican RepublicEarly-demographic dividendEast Asia & PacificEast Asia & Pacific (excluding high income)East Asia & Pacific (IDA & IBRD countries)EcuadorEgypt, Arab Rep.El SalvadorEquatorial GuineaEstoniaEthiopiaEuro areaEurope & Central AsiaEurope & Central Asia (excluding high income)Europe & Central Asia (IDA & IBRD countries)European UnionFijiFinlandFragile and conflict affected situationsFranceFrench PolynesiaGabonGambia, TheGeorgiaGermanyGhanaGreeceGrenadaGuatemalaGuineaGuinea-BissauGuyanaHaitiHeavily indebted poor countries (HIPC)High incomeHondurasHong Kong SAR, ChinaHungaryIBRD onlyIcelandIDA & IBRD totalIDA blendIDA onlyIDA totalIndiaIndonesiaIran, Islamic Rep.IraqIrelandIsraelItalyJamaicaJapanJordanKazakhstanKenyaKiribatiKorea, Rep.KuwaitKyrgyz RepublicLao PDRLate-demographic dividendLatin America & Caribbean Latin America & Caribbean (excluding high income)Latin America & the Caribbean (IDA & IBRD countries)LatviaLeast developed countries: UN classificationLebanonLesothoLiberiaLibyaLithuaniaLow & middle incomeLow incomeLower middle incomeLuxembourgMacao SAR, ChinaMacedonia, FYRMadagascarMalawiMalaysiaMaldivesMaliMaltaMarshall IslandsMauritaniaMauritiusMexicoMicronesia, Fed. Sts.Middle East & North AfricaMiddle East & North Africa (excluding high income)Middle East & North Africa (IDA & IBRD countries)Middle incomeMoldovaMongoliaMontenegroMoroccoMozambiqueMyanmarNamibiaNepalNetherlandsNew CaledoniaNicaraguaNigerNigeriaNorth AmericaNorwayOECD membersOmanOther small statesPacific island small statesPakistanPalauPanamaPapua New GuineaParaguayPeruPhilippinesPolandPortugalPost-demographic dividendPre-demographic dividendQatarRomaniaRussian FederationRwandaSamoaSao Tome and PrincipeSaudi ArabiaSenegalSerbiaSeychellesSierra LeoneSingaporeSint Maarten (Dutch part)Slovak RepublicSloveniaSmall statesSolomon IslandsSouth AfricaSouth AsiaSouth Asia (IDA & IBRD)SpainSri LankaSt. Kitts and NevisSt. LuciaSt. Vincent and the GrenadinesSub-Saharan Africa Sub-Saharan Africa (excluding high income)Sub-Saharan Africa (IDA & IBRD countries)SudanSurinameSwazilandSwedenSwitzerlandSyrian Arab RepublicTajikistanTanzaniaThailandTimor-LesteTogoTongaTrinidad and TobagoTunisiaTurkeyTuvaluUgandaUkraineUnited KingdomUnited StatesUpper middle incomeUruguayVanuatuVenezuela, RBVietnamWest Bank and GazaWorldYemen, Rep.Zambia
Zeitlinie:
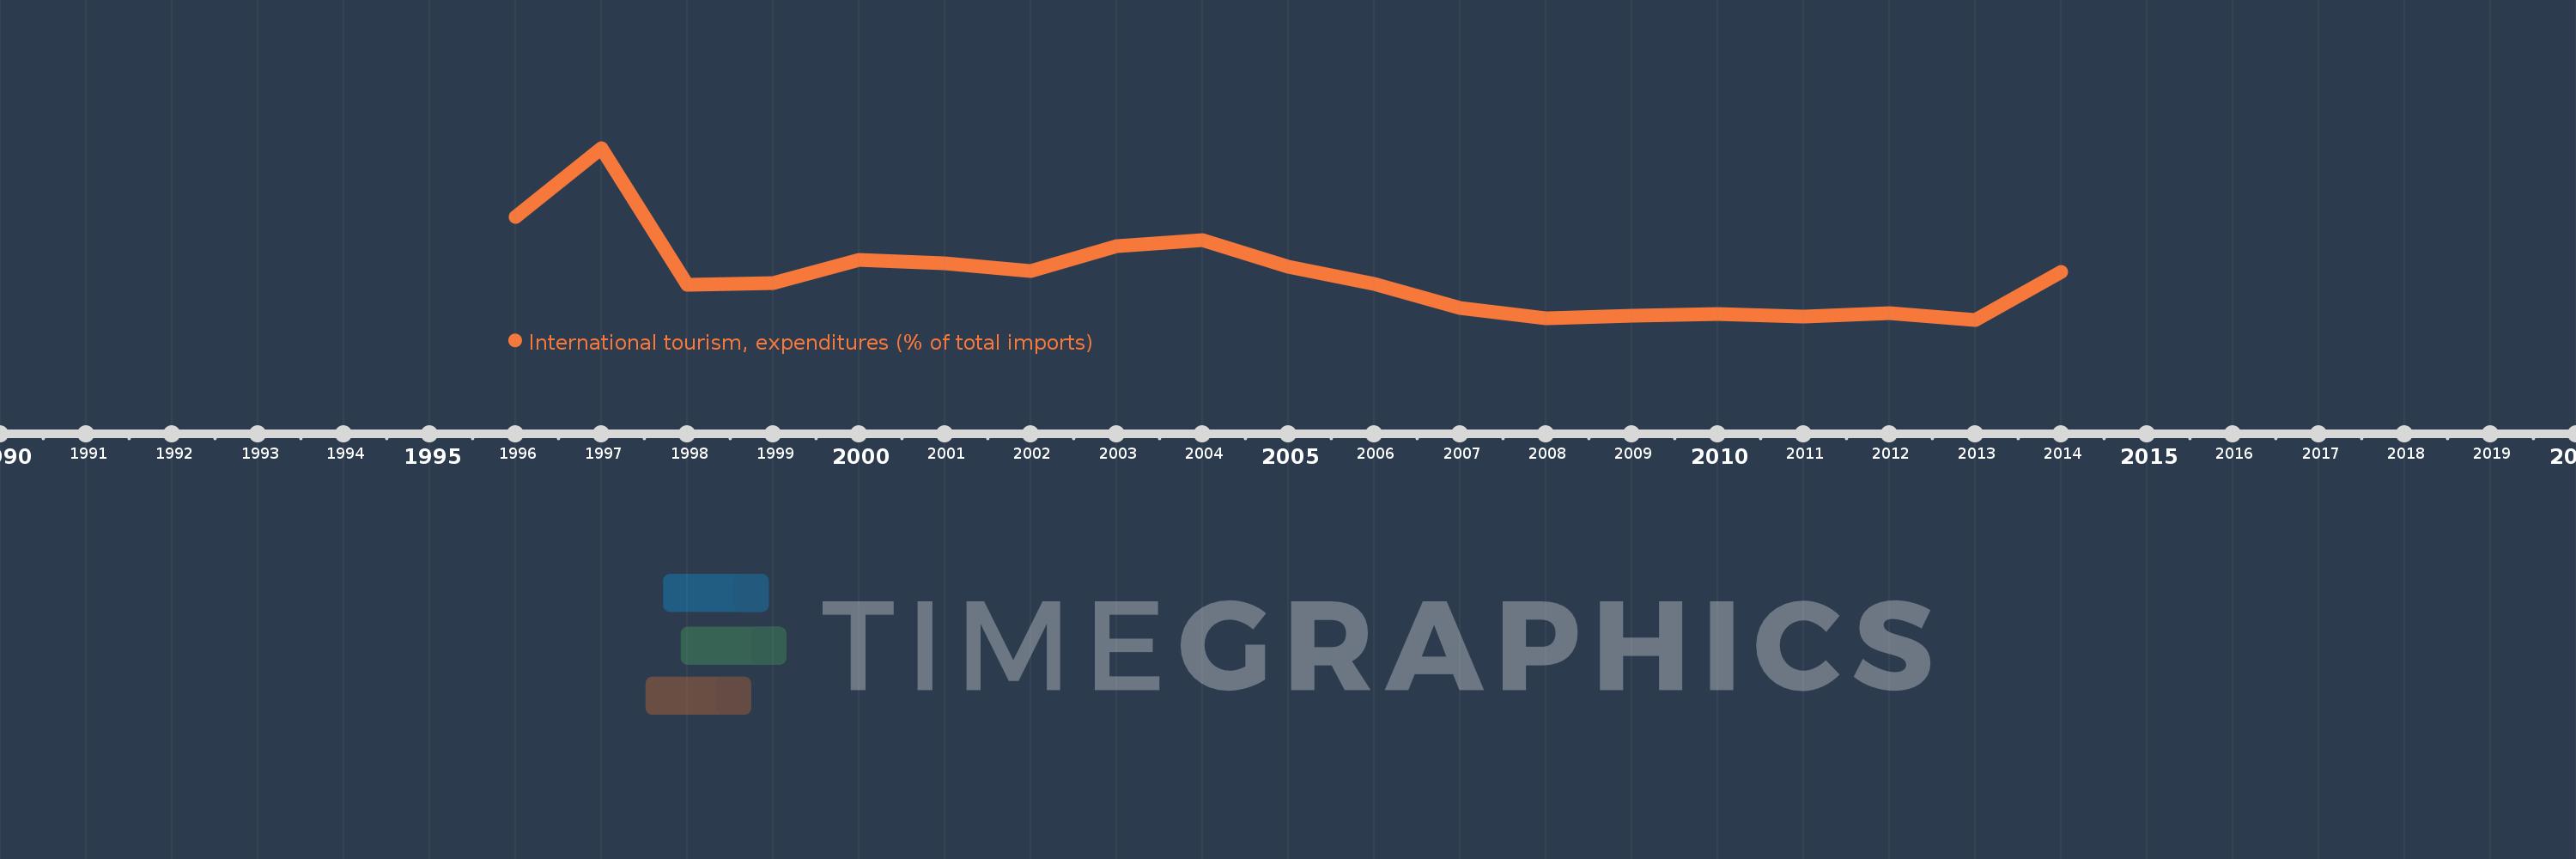
Diese Zeitleiste vorliegt die Graphik ab 1996 J. bis 2014 J. Venezuela, RB. Die Angaben bis 1995 J. sind nicht vorhanden. Die Zahl aktueller Beobachtungen nach Daten: 19.
Die Quelle (Bezeichnung):
Kennzahlen der Weltentwicklung
Die Quelle (Einrichtung):
World Tourism Organization, Yearbook of Tourism Statistics, Compendium of Tourism Statistics and data files, and IMF and World Bank imports estimates.
Kategorien:
Private Sector, Trade
Es wurde aktualisiert:
23 Apr 2017 Jahr
Kennzahlen der Wertänderungen vom Jahr zum Jahr
im Durchschnitt:
6.833
Minimum:
3.752
1 Jan 2013 Jahr
Maximum:
15.806
1 Jan 1997 Jahr
Zum Datum der Beobachtung
Wert
Absolute Veränderung
Die Veränderung bezüglich dem vorherigen Wert
1 Jan 1996 Jahr
10.955
+10.955
0.0%
1 Jan 1997 Jahr
15.806
+4.851
44.28%
1 Jan 1998 Jahr
6.2
-9.606
-60.78%
1 Jan 1999 Jahr
6.333
+0.133
2.15%
1 Jan 2000 Jahr
7.938
+1.605
25.34%
1 Jan 2001 Jahr
7.732
-0.205
-2.59%
1 Jan 2002 Jahr
7.191
-0.542
-7.01%
1 Jan 2003 Jahr
8.946
+1.755
24.41%
1 Jan 2004 Jahr
9.368
+0.422
4.72%
1 Jan 2005 Jahr
7.454
-1.913
-20.43%
1 Jan 2006 Jahr
6.28
-1.174
-15.75%
1 Jan 2007 Jahr
4.57
-1.71
-27.22%
1 Jan 2008 Jahr
3.853
-0.718
-15.7%
1 Jan 2009 Jahr
4.025
+0.173
4.48%
1 Jan 2010 Jahr
4.141
+0.116
2.89%
1 Jan 2011 Jahr
3.994
-0.148
-3.57%
1 Jan 2012 Jahr
4.208
+0.215
5.37%
1 Jan 2013 Jahr
3.752
-0.457
-10.85%
1 Jan 2014 Jahr
7.087
+3.335
88.89%
Bewertung der Länder gemäß mit laufender Statistik nach Jahren

Kommentare:

Abschicken
PremiumAbout & FeedbackVereinbarungPrivatheit
logo
© 2022 Selected Technologies LLC – Morgan Hill, California