30
/de/
AIzaSyAYiBZKx7MnpbEhh9jyipgxe19OcubqV5w
April 1, 2024
195739
Mexico
MEX
true
2
1
International tourism, expenditures (% of total imports)
2015,2014,2013,2012,2011,2010,2009,2008,2007,2006,2005,2004,2003,2002,2001,2000,1999,1998,1997,1996
Download
Bibliothek der Globalstatistik →Mexico →

International tourism, expenditures (% of total imports)

Diese Statistik in anderen Ländern:

AfghanistanAlbaniaAlgeriaAngolaAntigua and BarbudaArab WorldArgentinaArmeniaArubaAustraliaAustriaAzerbaijanBahamas, TheBahrainBangladeshBarbadosBelarusBelgiumBelizeBeninBermudaBhutanBoliviaBosnia and HerzegovinaBotswanaBrazilBrunei DarussalamBulgariaBurkina FasoBurundiCabo VerdeCambodiaCameroonCanadaCaribbean small statesCentral Europe and the BalticsChileChinaColombiaComorosCongo, Dem. Rep.Congo, Rep.Costa RicaCote d'IvoireCroatiaCuracaoCyprusCzech RepublicDenmarkDjiboutiDominicaDominican RepublicEarly-demographic dividendEast Asia & PacificEast Asia & Pacific (excluding high income)East Asia & Pacific (IDA & IBRD countries)EcuadorEgypt, Arab Rep.El SalvadorEquatorial GuineaEstoniaEthiopiaEuro areaEurope & Central AsiaEurope & Central Asia (excluding high income)Europe & Central Asia (IDA & IBRD countries)European UnionFijiFinlandFragile and conflict affected situationsFranceFrench PolynesiaGabonGambia, TheGeorgiaGermanyGhanaGreeceGrenadaGuatemalaGuineaGuinea-BissauGuyanaHaitiHeavily indebted poor countries (HIPC)High incomeHondurasHong Kong SAR, ChinaHungaryIBRD onlyIcelandIDA & IBRD totalIDA blendIDA onlyIDA totalIndiaIndonesiaIran, Islamic Rep.IraqIrelandIsraelItalyJamaicaJapanJordanKazakhstanKenyaKiribatiKorea, Rep.KuwaitKyrgyz RepublicLao PDRLate-demographic dividendLatin America & Caribbean Latin America & Caribbean (excluding high income)Latin America & the Caribbean (IDA & IBRD countries)LatviaLeast developed countries: UN classificationLebanonLesothoLiberiaLibyaLithuaniaLow & middle incomeLow incomeLower middle incomeLuxembourgMacao SAR, ChinaMacedonia, FYRMadagascarMalawiMalaysiaMaldivesMaliMaltaMarshall IslandsMauritaniaMauritiusMexicoMicronesia, Fed. Sts.Middle East & North AfricaMiddle East & North Africa (excluding high income)Middle East & North Africa (IDA & IBRD countries)Middle incomeMoldovaMongoliaMontenegroMoroccoMozambiqueMyanmarNamibiaNepalNetherlandsNew CaledoniaNicaraguaNigerNigeriaNorth AmericaNorwayOECD membersOmanOther small statesPacific island small statesPakistanPalauPanamaPapua New GuineaParaguayPeruPhilippinesPolandPortugalPost-demographic dividendPre-demographic dividendQatarRomaniaRussian FederationRwandaSamoaSao Tome and PrincipeSaudi ArabiaSenegalSerbiaSeychellesSierra LeoneSingaporeSint Maarten (Dutch part)Slovak RepublicSloveniaSmall statesSolomon IslandsSouth AfricaSouth AsiaSouth Asia (IDA & IBRD)SpainSri LankaSt. Kitts and NevisSt. LuciaSt. Vincent and the GrenadinesSub-Saharan Africa Sub-Saharan Africa (excluding high income)Sub-Saharan Africa (IDA & IBRD countries)SudanSurinameSwazilandSwedenSwitzerlandSyrian Arab RepublicTajikistanTanzaniaThailandTimor-LesteTogoTongaTrinidad and TobagoTunisiaTurkeyTuvaluUgandaUkraineUnited KingdomUnited StatesUpper middle incomeUruguayVanuatuVenezuela, RBVietnamWest Bank and GazaWorldYemen, Rep.Zambia

Zeitlinie:

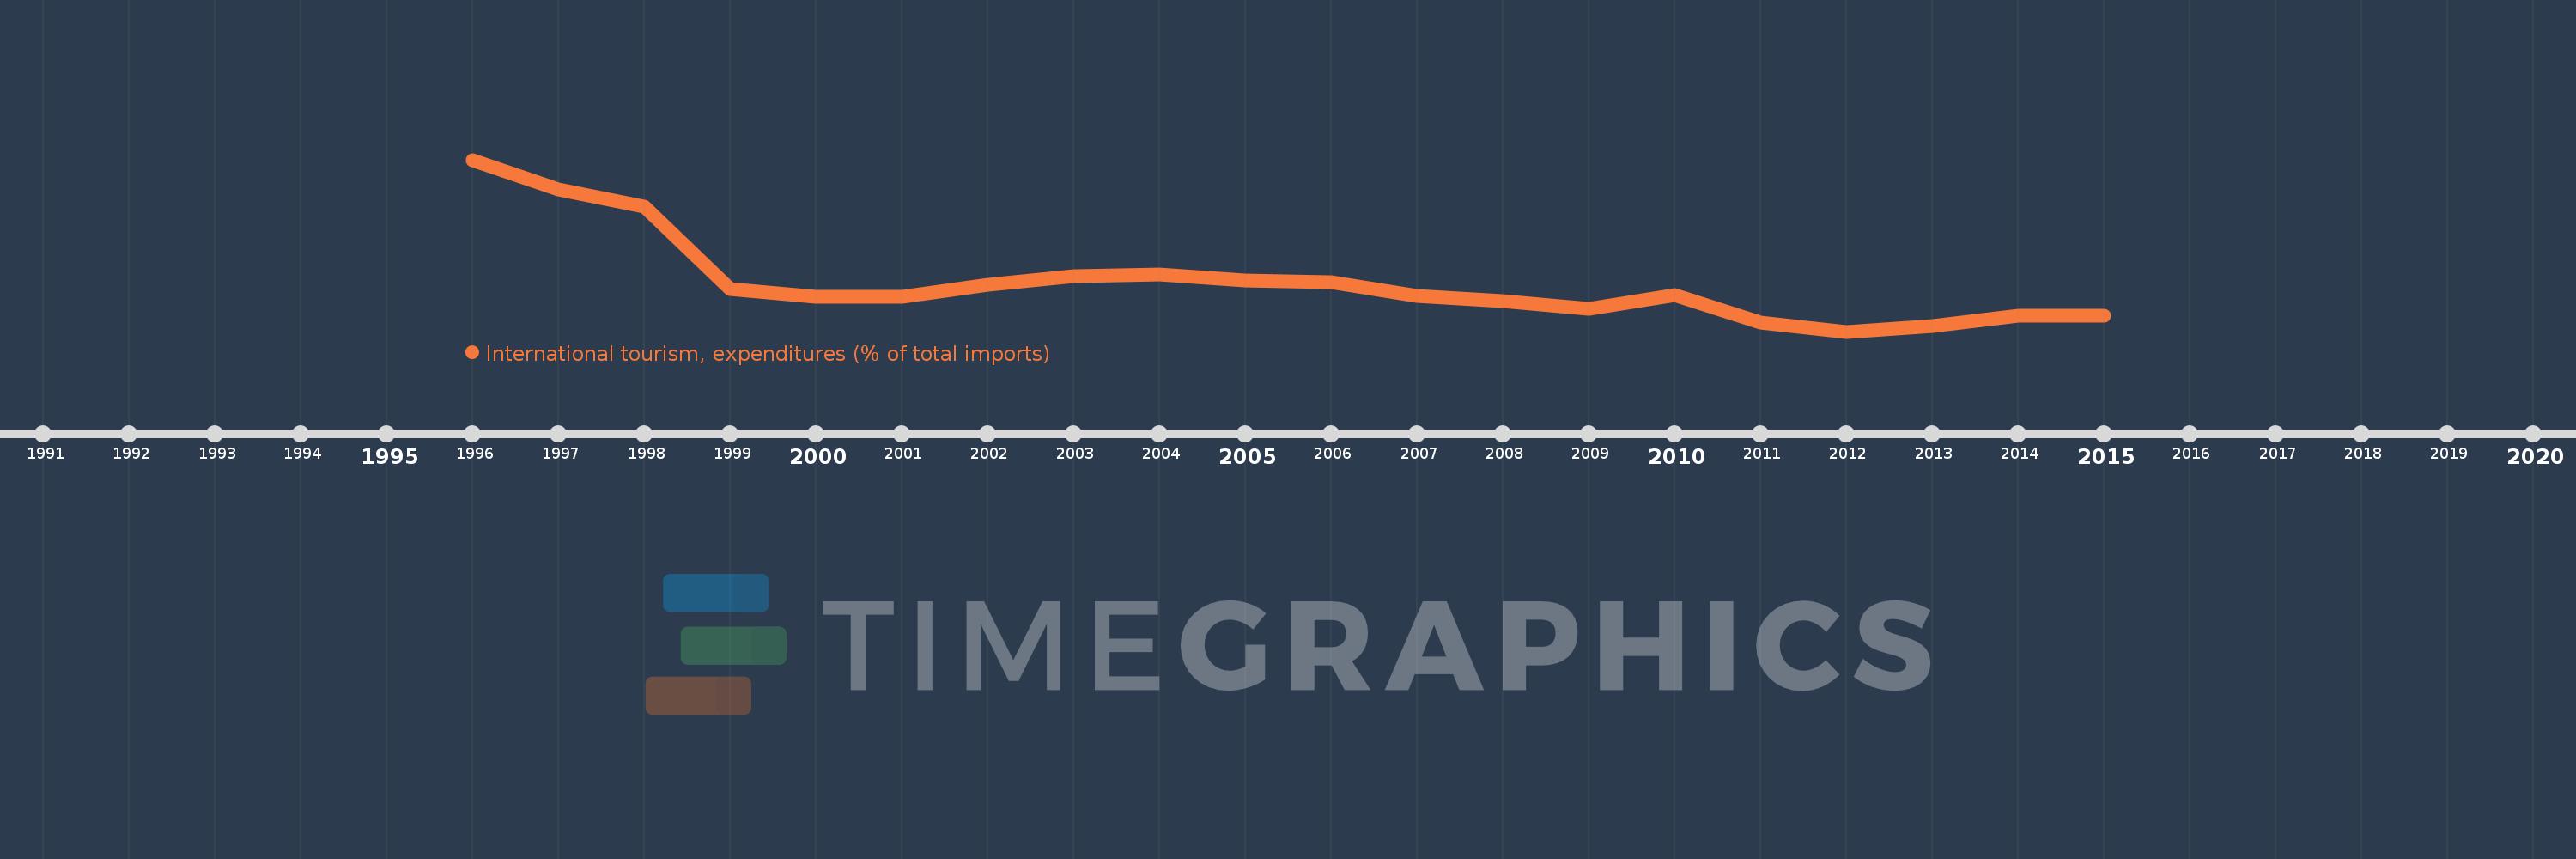
Diese Zeitleiste vorliegt die Graphik ab 1996 J. bis 2015 J. Mexico. Die Angaben bis 1995 J. sind nicht vorhanden. Die Zahl aktueller Beobachtungen nach Daten: 20.

Die Quelle (Bezeichnung):

Kennzahlen der Weltentwicklung

Die Quelle (Einrichtung):

World Tourism Organization, Yearbook of Tourism Statistics, Compendium of Tourism Statistics and data files, and IMF and World Bank imports estimates.

Kategorien:

Private Sector, Trade

Es wurde aktualisiert:

23 Apr 2017 Jahr

Kennzahlen der Wertänderungen vom Jahr zum Jahr

im Durchschnitt:
3.648
Minimum:
2.543
1 Jan 2012 Jahr
Maximum:
6.407
1 Jan 1996 Jahr
Zum Datum der Beobachtung
Wert
Absolute Veränderung
Die Veränderung bezüglich dem vorherigen Wert
1 Jan 1996 Jahr
6.407
+6.407
0.0%
1 Jan 1997 Jahr
5.749
-0.658
-10.27%
1 Jan 1998 Jahr
5.35
-0.399
-6.94%
1 Jan 1999 Jahr
3.493
-1.856
-34.7%
1 Jan 2000 Jahr
3.319
-0.175
-5.0%
1 Jan 2001 Jahr
3.318
0.0
-0.01%
1 Jan 2002 Jahr
3.602
+0.284
8.55%
1 Jan 2003 Jahr
3.795
+0.193
5.37%
1 Jan 2004 Jahr
3.836
+0.04
1.05%
1 Jan 2005 Jahr
3.691
-0.145
-3.78%
1 Jan 2006 Jahr
3.652
-0.039
-1.05%
1 Jan 2007 Jahr
3.349
-0.303
-8.29%
1 Jan 2008 Jahr
3.225
-0.124
-3.7%
1 Jan 2009 Jahr
3.057
-0.168
-5.21%
1 Jan 2010 Jahr
3.361
+0.304
9.94%
1 Jan 2011 Jahr
2.748
-0.614
-18.25%
1 Jan 2012 Jahr
2.543
-0.205
-7.44%
1 Jan 2013 Jahr
2.675
+0.132
5.19%
1 Jan 2014 Jahr
2.9
+0.225
8.39%
1 Jan 2015 Jahr
2.893
-0.006
-0.22%

Bewertung der Länder gemäß mit laufender Statistik nach Jahren