29
/de/
de
AIzaSyAYiBZKx7MnpbEhh9jyipgxe19OcubqV5w
April 1, 2024
280027
Vanuatu
VUT
true
2
1
Manufactures imports (% of merchandise imports)
2012,2011,2010,2008,2007,2001,1994,1985,1984,1983,1982,1981,1976,1975,1974,1973,1972,1971
Download
Bibliothek der Globalstatistik →Vanuatu →

Manufactures imports (% of merchandise imports)

Diese Statistik in anderen Ländern:
AfghanistanAlbaniaAlgeriaAndorraAngolaAntigua and BarbudaArab WorldArgentinaArmeniaArubaAustraliaAustriaAzerbaijanBahamas, TheBahrainBangladeshBarbadosBelarusBelgiumBelizeBeninBermudaBhutanBoliviaBosnia and HerzegovinaBotswanaBrazilBrunei DarussalamBulgariaBurkina FasoBurundiCabo VerdeCambodiaCameroonCanadaCaribbean small statesCayman IslandsCentral African RepublicCentral Europe and the BalticsChadChileChinaColombiaComorosCongo, Dem. Rep.Congo, Rep.Costa RicaCote d'IvoireCroatiaCubaCyprusCzech RepublicDenmarkDjiboutiDominicaDominican RepublicEarly-demographic dividendEast Asia & PacificEast Asia & Pacific (excluding high income)East Asia & Pacific (IDA & IBRD countries)EcuadorEgypt, Arab Rep.El SalvadorEquatorial GuineaEritreaEstoniaEthiopiaEuro areaEurope & Central AsiaEurope & Central Asia (excluding high income)Europe & Central Asia (IDA & IBRD countries)European UnionFaroe IslandsFijiFinlandFragile and conflict affected situationsFranceFrench PolynesiaGabonGambia, TheGeorgiaGermanyGhanaGreeceGreenlandGrenadaGuatemalaGuineaGuinea-BissauGuyanaHaitiHeavily indebted poor countries (HIPC)High incomeHondurasHong Kong SAR, ChinaHungaryIBRD onlyIcelandIDA & IBRD totalIDA blendIDA onlyIDA totalIndiaIndonesiaIran, Islamic Rep.IraqIrelandIsraelItalyJamaicaJapanJordanKazakhstanKenyaKiribatiKorea, Rep.KuwaitKyrgyz RepublicLao PDRLate-demographic dividendLatin America & Caribbean Latin America & Caribbean (excluding high income)Latin America & the Caribbean (IDA & IBRD countries)LatviaLeast developed countries: UN classificationLebanonLesothoLiberiaLibyaLithuaniaLow & middle incomeLow incomeLower middle incomeLuxembourgMacao SAR, ChinaMacedonia, FYRMadagascarMalawiMalaysiaMaldivesMaliMaltaMauritaniaMauritiusMexicoMiddle East & North AfricaMiddle East & North Africa (excluding high income)Middle East & North Africa (IDA & IBRD countries)Middle incomeMoldovaMongoliaMoroccoMozambiqueMyanmarNamibiaNepalNetherlandsNew CaledoniaNew ZealandNicaraguaNigerNigeriaNorth AmericaNorwayOECD membersOmanOther small statesPacific island small statesPakistanPalauPanamaPapua New GuineaParaguayPeruPhilippinesPolandPortugalPost-demographic dividendPre-demographic dividendQatarRomaniaRussian FederationRwandaSamoaSao Tome and PrincipeSaudi ArabiaSenegalSerbiaSeychellesSierra LeoneSingaporeSlovak RepublicSloveniaSmall statesSolomon IslandsSomaliaSouth AfricaSouth AsiaSouth Asia (IDA & IBRD)SpainSri LankaSt. Kitts and NevisSt. LuciaSt. Vincent and the GrenadinesSub-Saharan Africa Sub-Saharan Africa (excluding high income)Sub-Saharan Africa (IDA & IBRD countries)SudanSurinameSwazilandSwedenSwitzerlandSyrian Arab RepublicTajikistanTanzaniaThailandTimor-LesteTogoTongaTrinidad and TobagoTunisiaTurkeyTurkmenistanTurks and Caicos IslandsTuvaluUgandaUkraineUnited Arab EmiratesUnited KingdomUnited StatesUpper middle incomeUruguayVanuatuVenezuela, RBVietnamVirgin Islands (U.S.)WorldYemen, Rep.ZambiaZimbabwe
Zeitlinie:
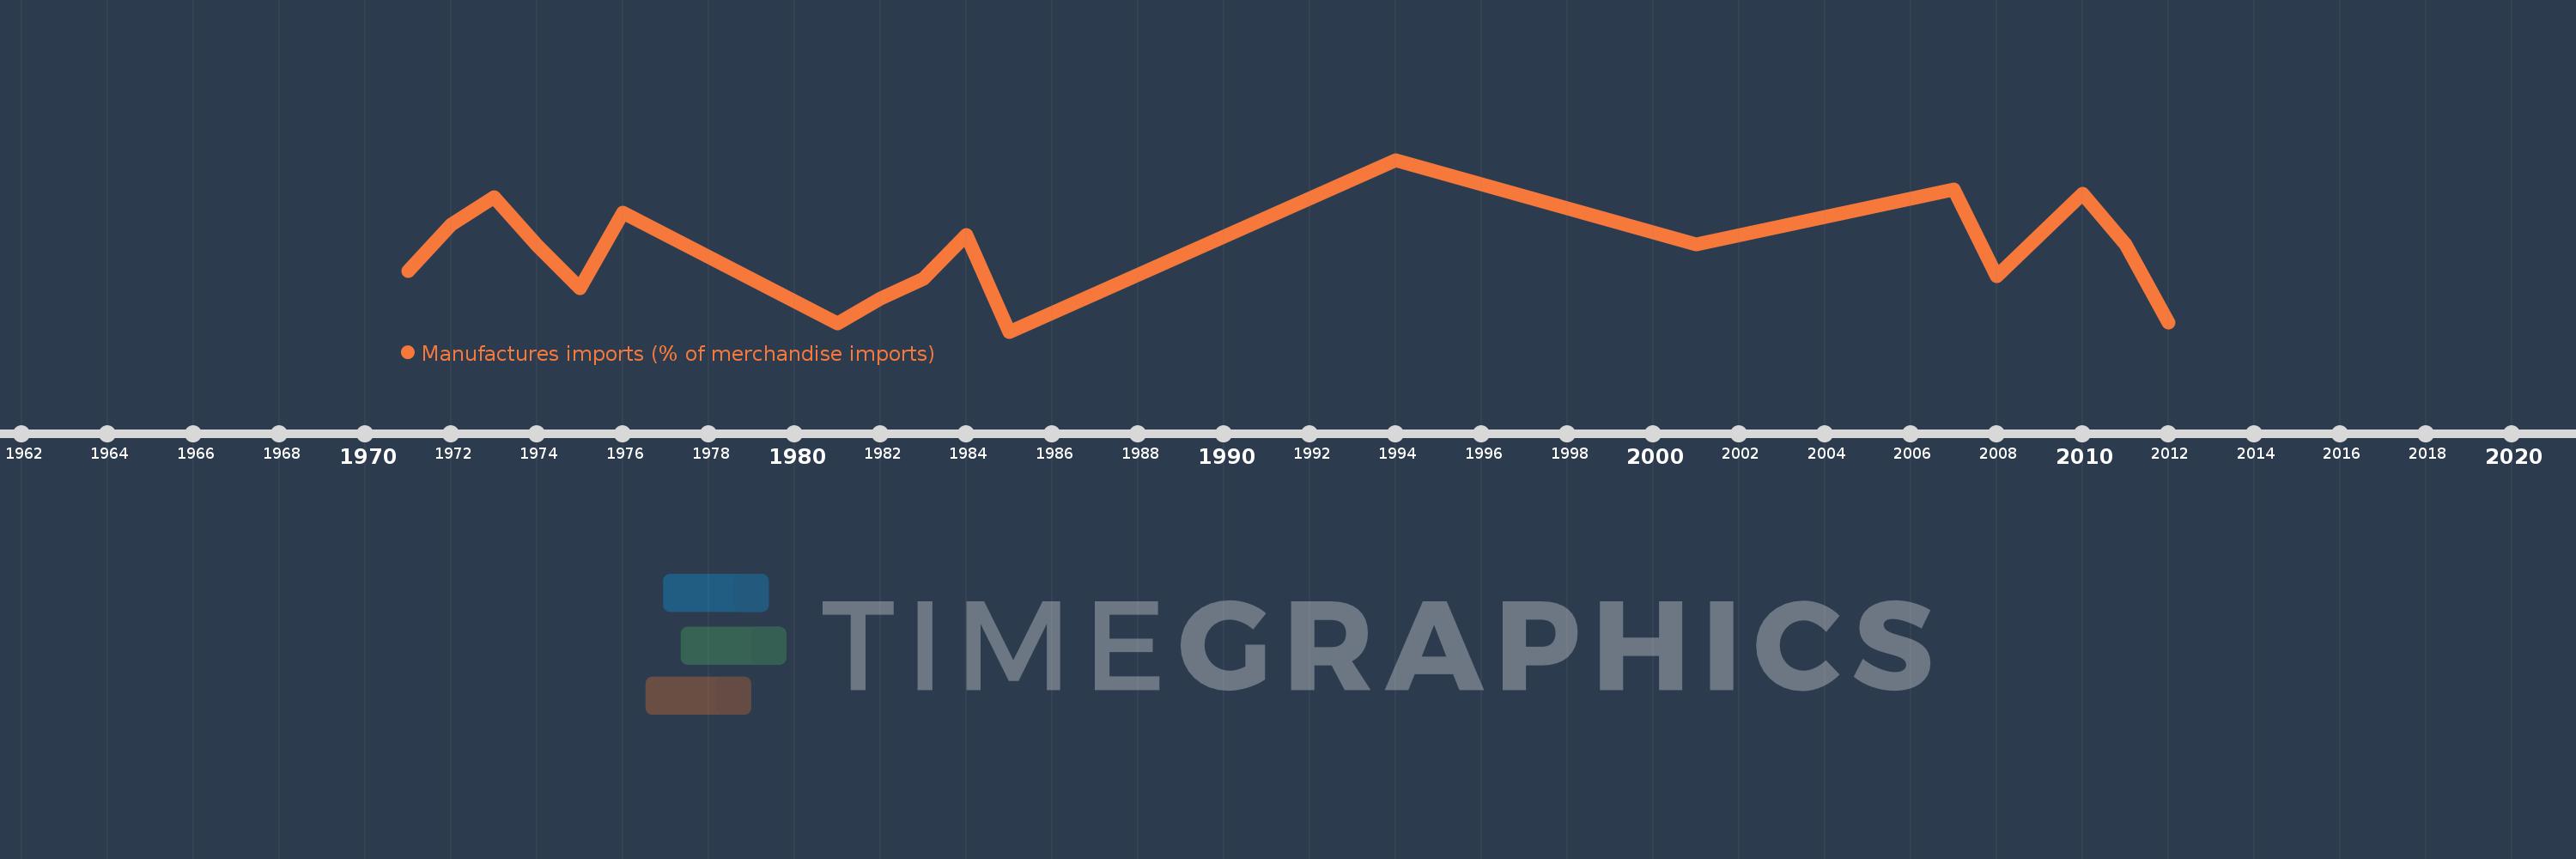
Diese Zeitleiste vorliegt die Graphik ab 1971 J. bis 2012 J. Vanuatu. Die Angaben bis 1970 J. sind nicht vorhanden. Die Zahl aktueller Beobachtungen nach Daten: 18.
Die Quelle (Bezeichnung):
Kennzahlen der Weltentwicklung
Die Quelle (Einrichtung):
World Bank staff estimates from the Comtrade database maintained by the United Nations Statistics Division.
Kategorien:
Private Sector, Trade
Es wurde aktualisiert:
23 Apr 2017 Jahr
Kennzahlen der Wertänderungen vom Jahr zum Jahr
im Durchschnitt:
57.962
Minimum:
51.522
1 Jan 1985 Jahr
Maximum:
65.431
1 Jan 1994 Jahr
Zum Datum der Beobachtung
Wert
Absolute Veränderung
Die Veränderung bezüglich dem vorherigen Wert
1 Jan 1971 Jahr
56.434
+56.434
0.0%
1 Jan 1972 Jahr
60.167
+3.733
6.61%
1 Jan 1973 Jahr
62.423
+2.257
3.75%
1 Jan 1974 Jahr
58.543
-3.88
-6.22%
1 Jan 1975 Jahr
55.05
-3.493
-5.97%
1 Jan 1976 Jahr
61.146
+6.096
11.07%
1 Jan 1981 Jahr
52.149
-8.997
-14.71%
1 Jan 1982 Jahr
54.201
+2.052
3.93%
1 Jan 1983 Jahr
55.826
+1.626
3.0%
1 Jan 1984 Jahr
59.358
+3.532
6.33%
1 Jan 1985 Jahr
51.522
-7.836
-13.2%
1 Jan 1994 Jahr
65.431
+13.909
27.0%
1 Jan 2001 Jahr
58.579
-6.852
-10.47%
1 Jan 2007 Jahr
63.014
+4.435
7.57%
1 Jan 2008 Jahr
56.006
-7.009
-11.12%
1 Jan 2010 Jahr
62.658
+6.653
11.88%
1 Jan 2011 Jahr
58.579
-4.079
-6.51%
1 Jan 2012 Jahr
52.233
-6.346
-10.83%
Bewertung der Länder gemäß mit laufender Statistik nach Jahren

Kommentare:

Abschicken
PremiumAbout & FeedbackVereinbarungPrivatheit
logo
© 2022 Selected Technologies LLC – Morgan Hill, California