33
/de/
AIzaSyAYiBZKx7MnpbEhh9jyipgxe19OcubqV5w
August 1, 2025
108748
Comoros
COM
true
2
1
Manufactures imports (% of merchandise imports)
2014,2013,2012,2011,2010,2009,2008,2007,2006,2005,2004,2003,2002,2001,2000,1999,1998,1997,1996,1963
Download
Bibliothek der Globalstatistik →Comoros →

Manufactures imports (% of merchandise imports)

Diese Statistik in anderen Ländern:

AfghanistanAlbaniaAlgeriaAndorraAngolaAntigua and BarbudaArab WorldArgentinaArmeniaArubaAustraliaAustriaAzerbaijanBahamas, TheBahrainBangladeshBarbadosBelarusBelgiumBelizeBeninBermudaBhutanBoliviaBosnia and HerzegovinaBotswanaBrazilBrunei DarussalamBulgariaBurkina FasoBurundiCabo VerdeCambodiaCameroonCanadaCaribbean small statesCayman IslandsCentral African RepublicCentral Europe and the BalticsChadChileChinaColombiaComorosCongo, Dem. Rep.Congo, Rep.Costa RicaCote d'IvoireCroatiaCubaCyprusCzech RepublicDenmarkDjiboutiDominicaDominican RepublicEarly-demographic dividendEast Asia & PacificEast Asia & Pacific (excluding high income)East Asia & Pacific (IDA & IBRD countries)EcuadorEgypt, Arab Rep.El SalvadorEquatorial GuineaEritreaEstoniaEthiopiaEuro areaEurope & Central AsiaEurope & Central Asia (excluding high income)Europe & Central Asia (IDA & IBRD countries)European UnionFaroe IslandsFijiFinlandFragile and conflict affected situationsFranceFrench PolynesiaGabonGambia, TheGeorgiaGermanyGhanaGreeceGreenlandGrenadaGuatemalaGuineaGuinea-BissauGuyanaHaitiHeavily indebted poor countries (HIPC)High incomeHondurasHong Kong SAR, ChinaHungaryIBRD onlyIcelandIDA & IBRD totalIDA blendIDA onlyIDA totalIndiaIndonesiaIran, Islamic Rep.IraqIrelandIsraelItalyJamaicaJapanJordanKazakhstanKenyaKiribatiKorea, Rep.KuwaitKyrgyz RepublicLao PDRLate-demographic dividendLatin America & Caribbean Latin America & Caribbean (excluding high income)Latin America & the Caribbean (IDA & IBRD countries)LatviaLeast developed countries: UN classificationLebanonLesothoLiberiaLibyaLithuaniaLow & middle incomeLow incomeLower middle incomeLuxembourgMacao SAR, ChinaMacedonia, FYRMadagascarMalawiMalaysiaMaldivesMaliMaltaMauritaniaMauritiusMexicoMiddle East & North AfricaMiddle East & North Africa (excluding high income)Middle East & North Africa (IDA & IBRD countries)Middle incomeMoldovaMongoliaMoroccoMozambiqueMyanmarNamibiaNepalNetherlandsNew CaledoniaNew ZealandNicaraguaNigerNigeriaNorth AmericaNorwayOECD membersOmanOther small statesPacific island small statesPakistanPalauPanamaPapua New GuineaParaguayPeruPhilippinesPolandPortugalPost-demographic dividendPre-demographic dividendQatarRomaniaRussian FederationRwandaSamoaSao Tome and PrincipeSaudi ArabiaSenegalSerbiaSeychellesSierra LeoneSingaporeSlovak RepublicSloveniaSmall statesSolomon IslandsSomaliaSouth AfricaSouth AsiaSouth Asia (IDA & IBRD)SpainSri LankaSt. Kitts and NevisSt. LuciaSt. Vincent and the GrenadinesSub-Saharan Africa Sub-Saharan Africa (excluding high income)Sub-Saharan Africa (IDA & IBRD countries)SudanSurinameSwazilandSwedenSwitzerlandSyrian Arab RepublicTajikistanTanzaniaThailandTimor-LesteTogoTongaTrinidad and TobagoTunisiaTurkeyTurkmenistanTurks and Caicos IslandsTuvaluUgandaUkraineUnited Arab EmiratesUnited KingdomUnited StatesUpper middle incomeUruguayVanuatuVenezuela, RBVietnamVirgin Islands (U.S.)WorldYemen, Rep.ZambiaZimbabwe

Zeitlinie:

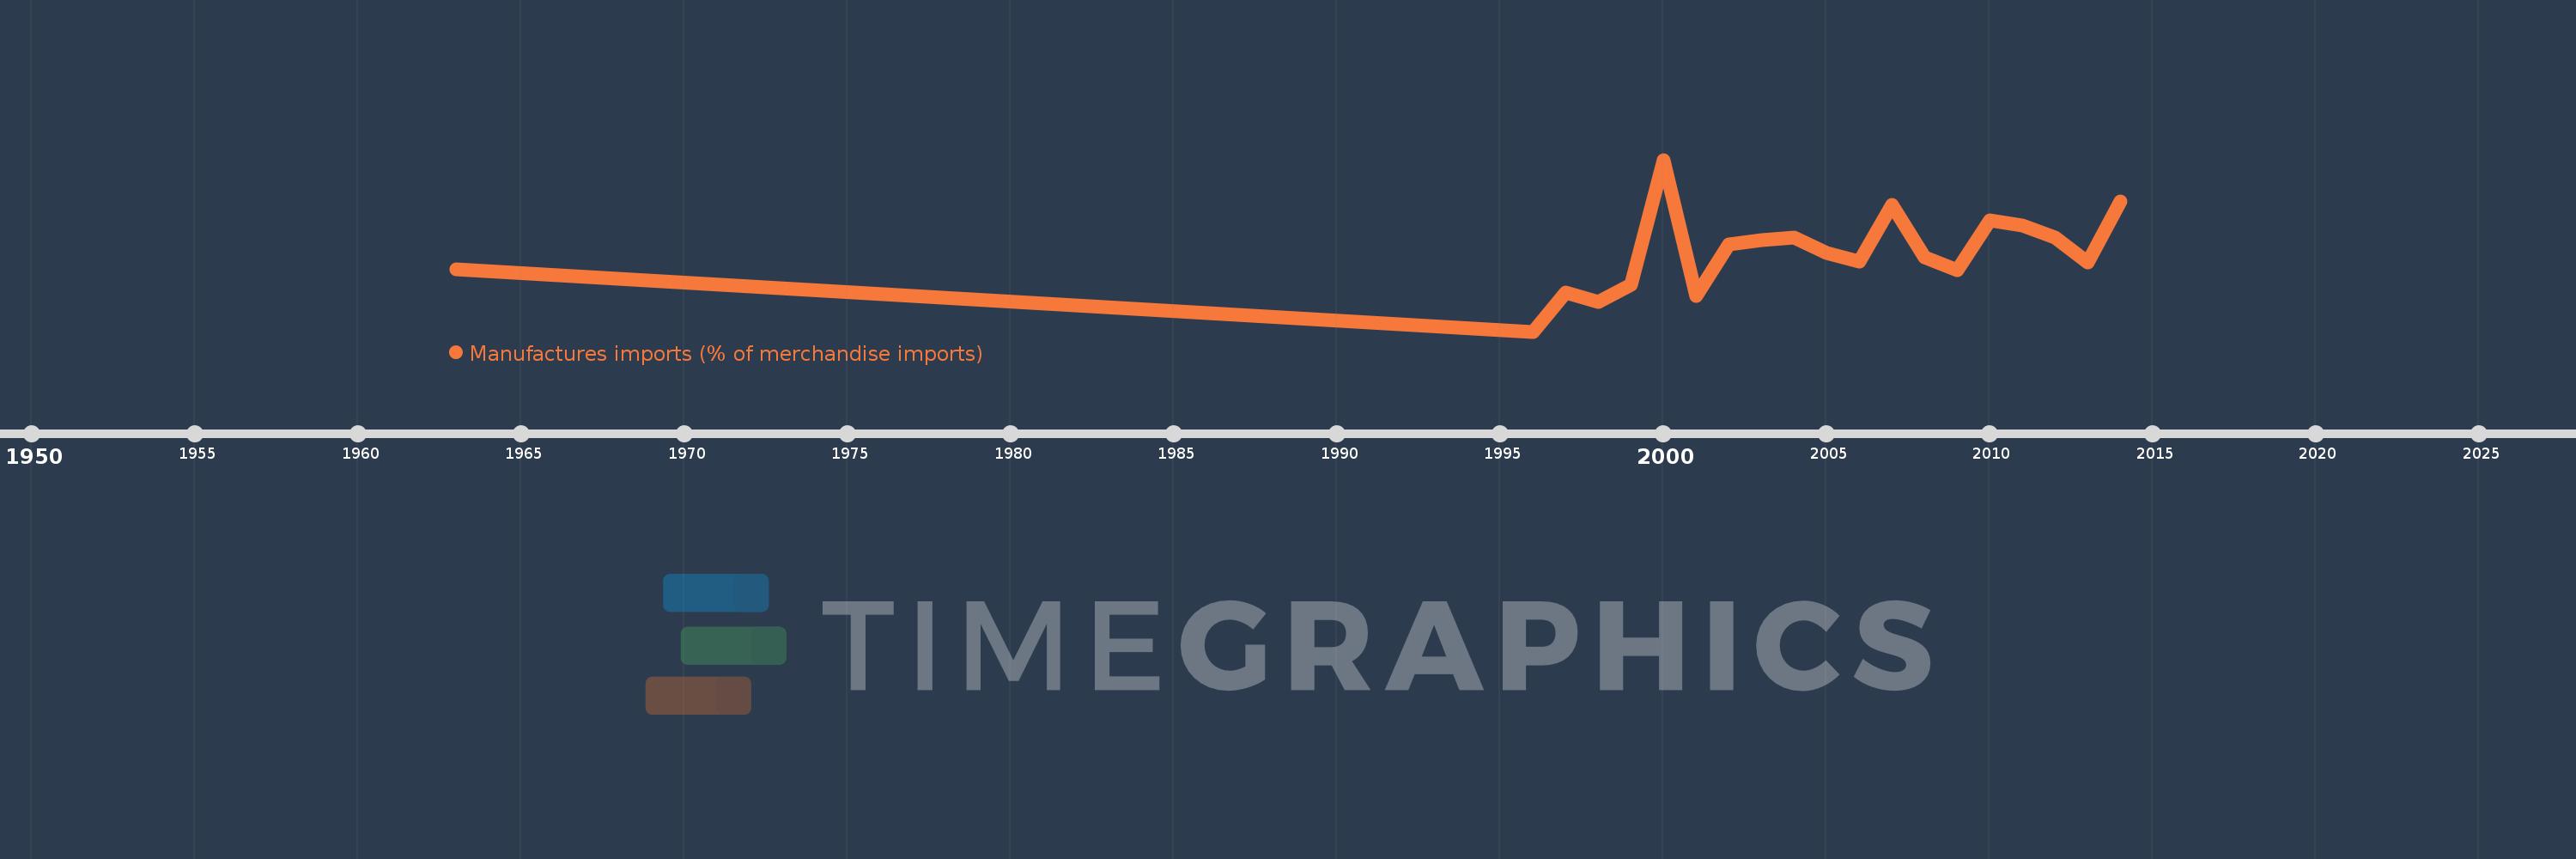
Diese Zeitleiste vorliegt die Graphik ab 1963 J. bis 2014 J. Comoros. Die Angaben bis 1962 J. sind nicht vorhanden. Die Zahl aktueller Beobachtungen nach Daten: 20.

Die Quelle (Bezeichnung):

Kennzahlen der Weltentwicklung

Die Quelle (Einrichtung):

World Bank staff estimates from the Comtrade database maintained by the United Nations Statistics Division.

Kategorien:

Private Sector, Trade

Es wurde aktualisiert:

23 Apr 2017 Jahr

Kennzahlen der Wertänderungen vom Jahr zum Jahr

im Durchschnitt:
54.68
Minimum:
36.7
1 Jan 1996 Jahr
Maximum:
75.77
1 Jan 2000 Jahr
Zum Datum der Beobachtung
Wert
Absolute Veränderung
Die Veränderung bezüglich dem vorherigen Wert
1 Jan 1963 Jahr
50.957
+50.957
0.0%
1 Jan 1996 Jahr
36.7
-14.256
-27.98%
1 Jan 1997 Jahr
45.65
+8.949
24.38%
1 Jan 1998 Jahr
43.45
-2.2
-4.82%
1 Jan 1999 Jahr
47.276
+3.826
8.81%
1 Jan 2000 Jahr
75.77
+28.494
60.27%
1 Jan 2001 Jahr
44.882
-30.888
-40.77%
1 Jan 2002 Jahr
56.56
+11.678
26.02%
1 Jan 2003 Jahr
57.525
+0.964
1.7%
1 Jan 2004 Jahr
58.089
+0.565
0.98%
1 Jan 2005 Jahr
54.515
-3.574
-6.15%
1 Jan 2006 Jahr
52.699
-1.816
-3.33%
1 Jan 2007 Jahr
65.51
+12.811
24.31%
1 Jan 2008 Jahr
53.509
-12.001
-18.32%
1 Jan 2009 Jahr
50.716
-2.794
-5.22%
1 Jan 2010 Jahr
62.08
+11.364
22.41%
1 Jan 2011 Jahr
60.808
-1.272
-2.05%
1 Jan 2012 Jahr
58.16
-2.648
-4.35%
1 Jan 2013 Jahr
52.449
-5.711
-9.82%
1 Jan 2014 Jahr
66.29
+13.841
26.39%

Bewertung der Länder gemäß mit laufender Statistik nach Jahren