33
/de/
AIzaSyB4mHJ5NPEv-XzF7P6NDYXjlkCWaeKw5bc
November 30, 2025
268692
Tunisia
TUN
true
2
1
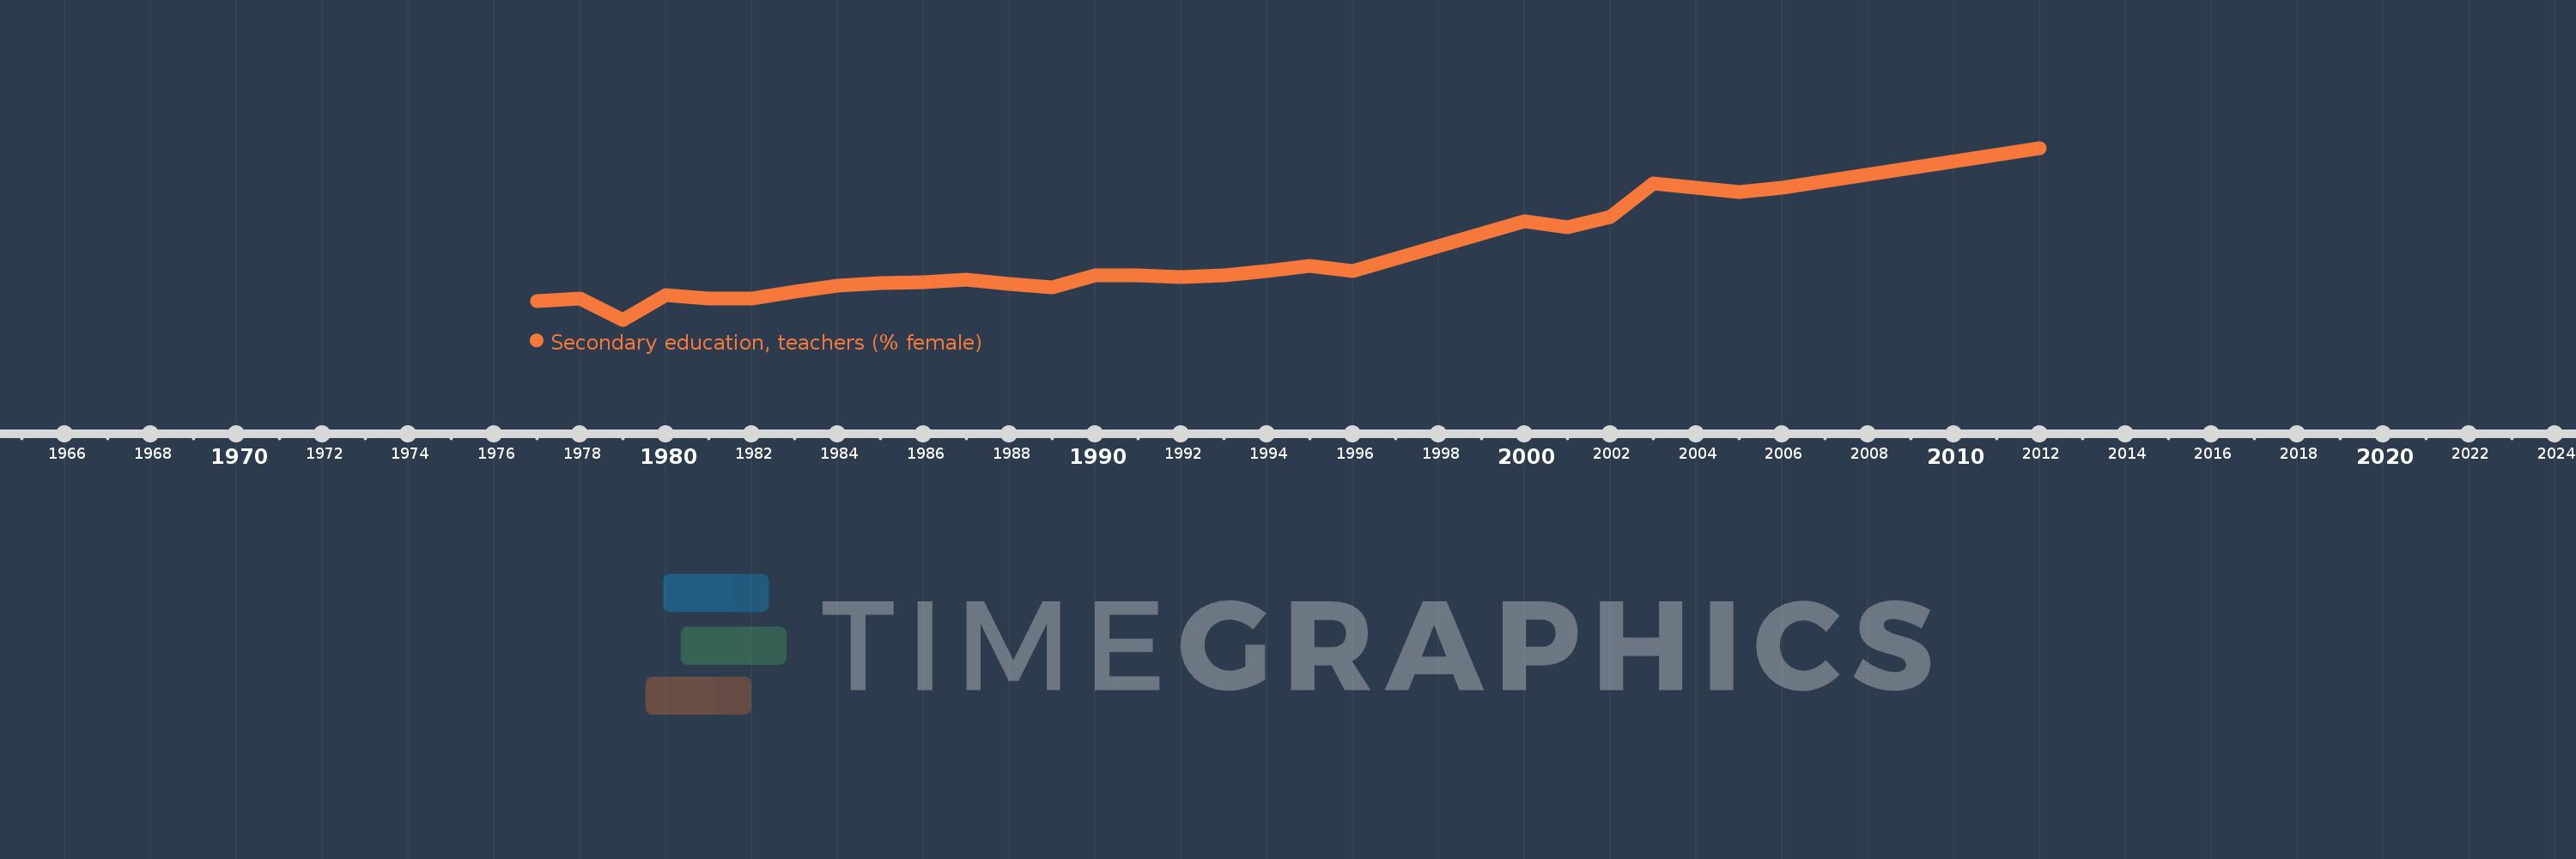
Secondary education, teachers (% female)
2012,2006,2005,2003,2002,2001,2000,1996,1995,1994,1993,1992,1991,1990,1989,1988,1987,1986,1985,1984,1983,1982,1981,1980,1979,1978,1977