33
/de/
AIzaSyAYiBZKx7MnpbEhh9jyipgxe19OcubqV5w
August 1, 2025
107979
Colombia
COL
true
2
1
Secondary education, teachers (% female)
2015,2014,2013,2012,2011,2010,2008,2007,2006,2005,2003,2002,2001,2000,1997,1984,1983,1982,1981,1980,1979,1978,1976,1973,1972
Download
Bibliothek der Globalstatistik →Colombia →

Secondary education, teachers (% female)

Diese Statistik in anderen Ländern:

AfghanistanAlbaniaAlgeriaAndorraAngolaAntigua and BarbudaArab WorldArgentinaArmeniaArubaAustraliaAustriaBahamas, TheBahrainBangladeshBarbadosBelarusBelgiumBelizeBeninBermudaBhutanBoliviaBosnia and HerzegovinaBotswanaBrazilBritish Virgin IslandsBrunei DarussalamBulgariaBurkina FasoBurundiCabo VerdeCambodiaCameroonCanadaCaribbean small statesCayman IslandsCentral African RepublicCentral Europe and the BalticsChadChileChinaColombiaComorosCongo, Dem. Rep.Congo, Rep.Costa RicaCote d'IvoireCroatiaCubaCyprusCzech RepublicDenmarkDjiboutiDominicaDominican RepublicEarly-demographic dividendEast Asia & PacificEast Asia & Pacific (excluding high income)East Asia & Pacific (IDA & IBRD countries)EcuadorEgypt, Arab Rep.El SalvadorEquatorial GuineaEritreaEstoniaEthiopiaEuro areaEurope & Central AsiaEurope & Central Asia (excluding high income)Europe & Central Asia (IDA & IBRD countries)European UnionFijiFinlandFragile and conflict affected situationsFranceGabonGambia, TheGeorgiaGermanyGhanaGibraltarGreeceGrenadaGuatemalaGuineaGuinea-BissauGuyanaHeavily indebted poor countries (HIPC)High incomeHondurasHong Kong SAR, ChinaHungaryIBRD onlyIcelandIDA & IBRD totalIDA blendIDA onlyIDA totalIndiaIndonesiaIran, Islamic Rep.IraqIrelandIsraelItalyJamaicaJapanJordanKazakhstanKenyaKiribatiKorea, Dem. People’s Rep.Korea, Rep.KuwaitKyrgyz RepublicLao PDRLate-demographic dividendLatin America & Caribbean Latin America & Caribbean (excluding high income)Latin America & the Caribbean (IDA & IBRD countries)LatviaLeast developed countries: UN classificationLebanonLesothoLiberiaLibyaLiechtensteinLithuaniaLow & middle incomeLow incomeLower middle incomeLuxembourgMacao SAR, ChinaMacedonia, FYRMadagascarMalawiMalaysiaMaldivesMaliMaltaMarshall IslandsMauritaniaMauritiusMexicoMiddle East & North AfricaMiddle East & North Africa (excluding high income)Middle East & North Africa (IDA & IBRD countries)Middle incomeMoldovaMonacoMongoliaMoroccoMozambiqueMyanmarNamibiaNauruNepalNetherlandsNew ZealandNicaraguaNigerNigeriaNorth AmericaNorwayOECD membersOmanOther small statesPacific island small statesPakistanPalauPanamaPapua New GuineaParaguayPeruPhilippinesPolandPortugalPost-demographic dividendPre-demographic dividendPuerto RicoQatarRomaniaRussian FederationRwandaSamoaSan MarinoSao Tome and PrincipeSaudi ArabiaSenegalSerbiaSeychellesSierra LeoneSingaporeSint Maarten (Dutch part)Slovak RepublicSloveniaSmall statesSolomon IslandsSomaliaSouth AfricaSouth AsiaSouth Asia (IDA & IBRD)SpainSri LankaSt. Kitts and NevisSt. LuciaSt. Vincent and the GrenadinesSub-Saharan Africa Sub-Saharan Africa (excluding high income)Sub-Saharan Africa (IDA & IBRD countries)SudanSurinameSwazilandSwedenSwitzerlandSyrian Arab RepublicTajikistanTanzaniaThailandTimor-LesteTogoTongaTrinidad and TobagoTunisiaTurkeyTurks and Caicos IslandsUgandaUkraineUnited Arab EmiratesUnited KingdomUnited StatesUpper middle incomeUruguayUzbekistanVanuatuVenezuela, RBVietnamWest Bank and GazaWorldYemen, Rep.ZambiaZimbabwe

Zeitlinie:

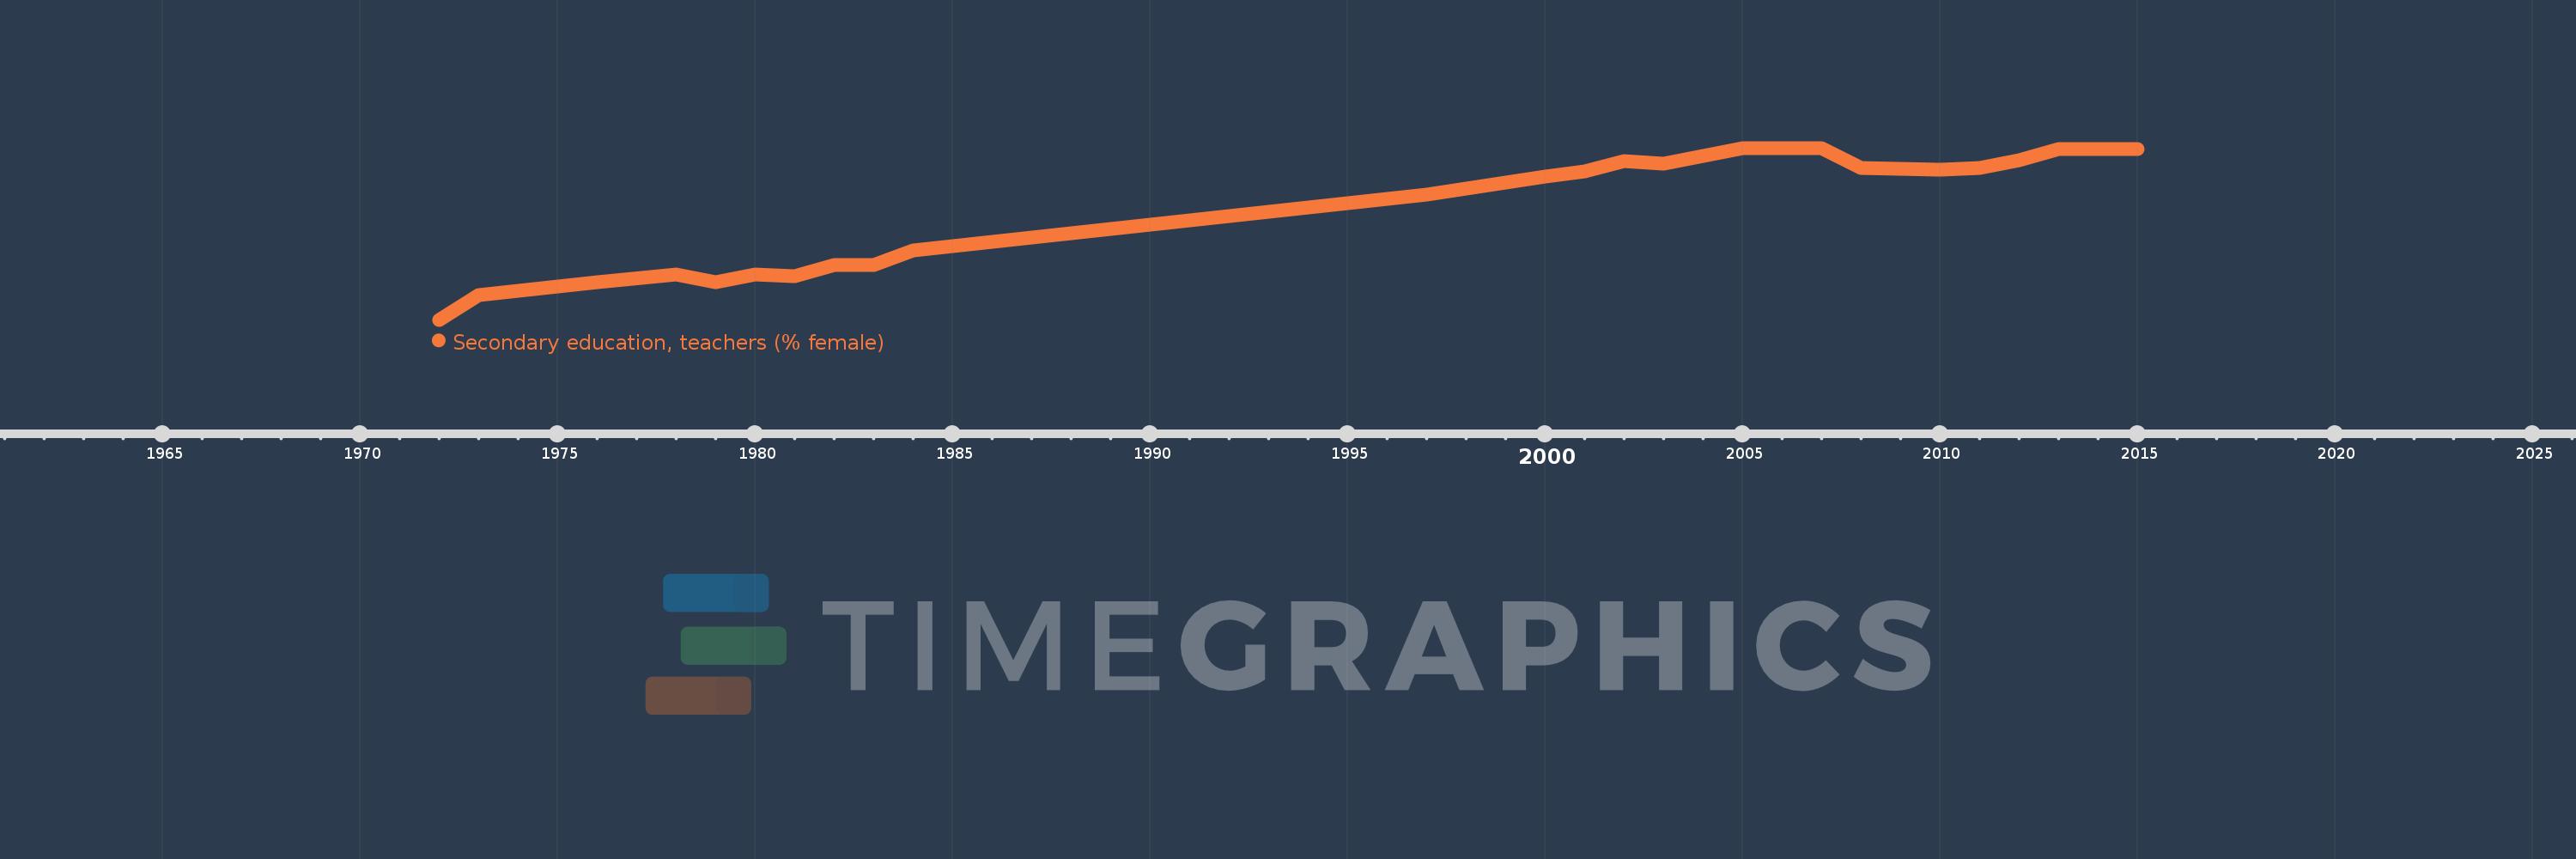
Diese Zeitleiste vorliegt die Graphik ab 1972 J. bis 2015 J. Colombia. Die Angaben bis 1971 J. sind nicht vorhanden. Die Zahl aktueller Beobachtungen nach Daten: 25.

Die Quelle (Bezeichnung):

Kennzahlen der Weltentwicklung

Die Quelle (Einrichtung):

United Nations Educational, Scientific, and Cultural Organization (UNESCO) Institute for Statistics.

Kategorien:

Education, Gender

Es wurde aktualisiert:

23 Apr 2017 Jahr

Kennzahlen der Wertänderungen vom Jahr zum Jahr

im Durchschnitt:
47.06
Minimum:
38.704
1 Jan 1972 Jahr
Maximum:
51.593
1 Jan 2007 Jahr
Zum Datum der Beobachtung
Wert
Absolute Veränderung
Die Veränderung bezüglich dem vorherigen Wert
1 Jan 1972 Jahr
38.704
+38.704
0.0%
1 Jan 1973 Jahr
40.581
+1.877
4.85%
1 Jan 1976 Jahr
41.5
+0.919
2.26%
1 Jan 1978 Jahr
42.1
+0.6
1.45%
1 Jan 1979 Jahr
41.499
-0.6
-1.43%
1 Jan 1980 Jahr
42.099
+0.6
1.45%
1 Jan 1981 Jahr
41.999
-0.1
-0.24%
1 Jan 1982 Jahr
42.8
+0.801
1.91%
1 Jan 1983 Jahr
42.8
0.0
0.0%
1 Jan 1984 Jahr
43.886
+1.086
2.54%
1 Jan 1997 Jahr
48.088
+4.202
9.57%
1 Jan 2000 Jahr
49.468
+1.38
2.87%
1 Jan 2001 Jahr
49.839
+0.372
0.75%
1 Jan 2002 Jahr
50.587
+0.748
1.5%
1 Jan 2003 Jahr
50.382
-0.205
-0.41%
1 Jan 2005 Jahr
51.583
+1.201
2.38%
1 Jan 2006 Jahr
51.583
+0.0
0.0%
1 Jan 2007 Jahr
51.593
+0.01
0.02%
1 Jan 2008 Jahr
50.105
-1.488
-2.88%
1 Jan 2010 Jahr
49.989
-0.117
-0.23%
1 Jan 2011 Jahr
50.123
+0.135
0.27%
1 Jan 2012 Jahr
50.665
+0.541
1.08%
1 Jan 2013 Jahr
51.509
+0.845
1.67%
1 Jan 2014 Jahr
51.492
-0.017
-0.03%
1 Jan 2015 Jahr
51.529
+0.037
0.07%

Bewertung der Länder gemäß mit laufender Statistik nach Jahren