33
/de/
AIzaSyB4mHJ5NPEv-XzF7P6NDYXjlkCWaeKw5bc
November 30, 2025
267494
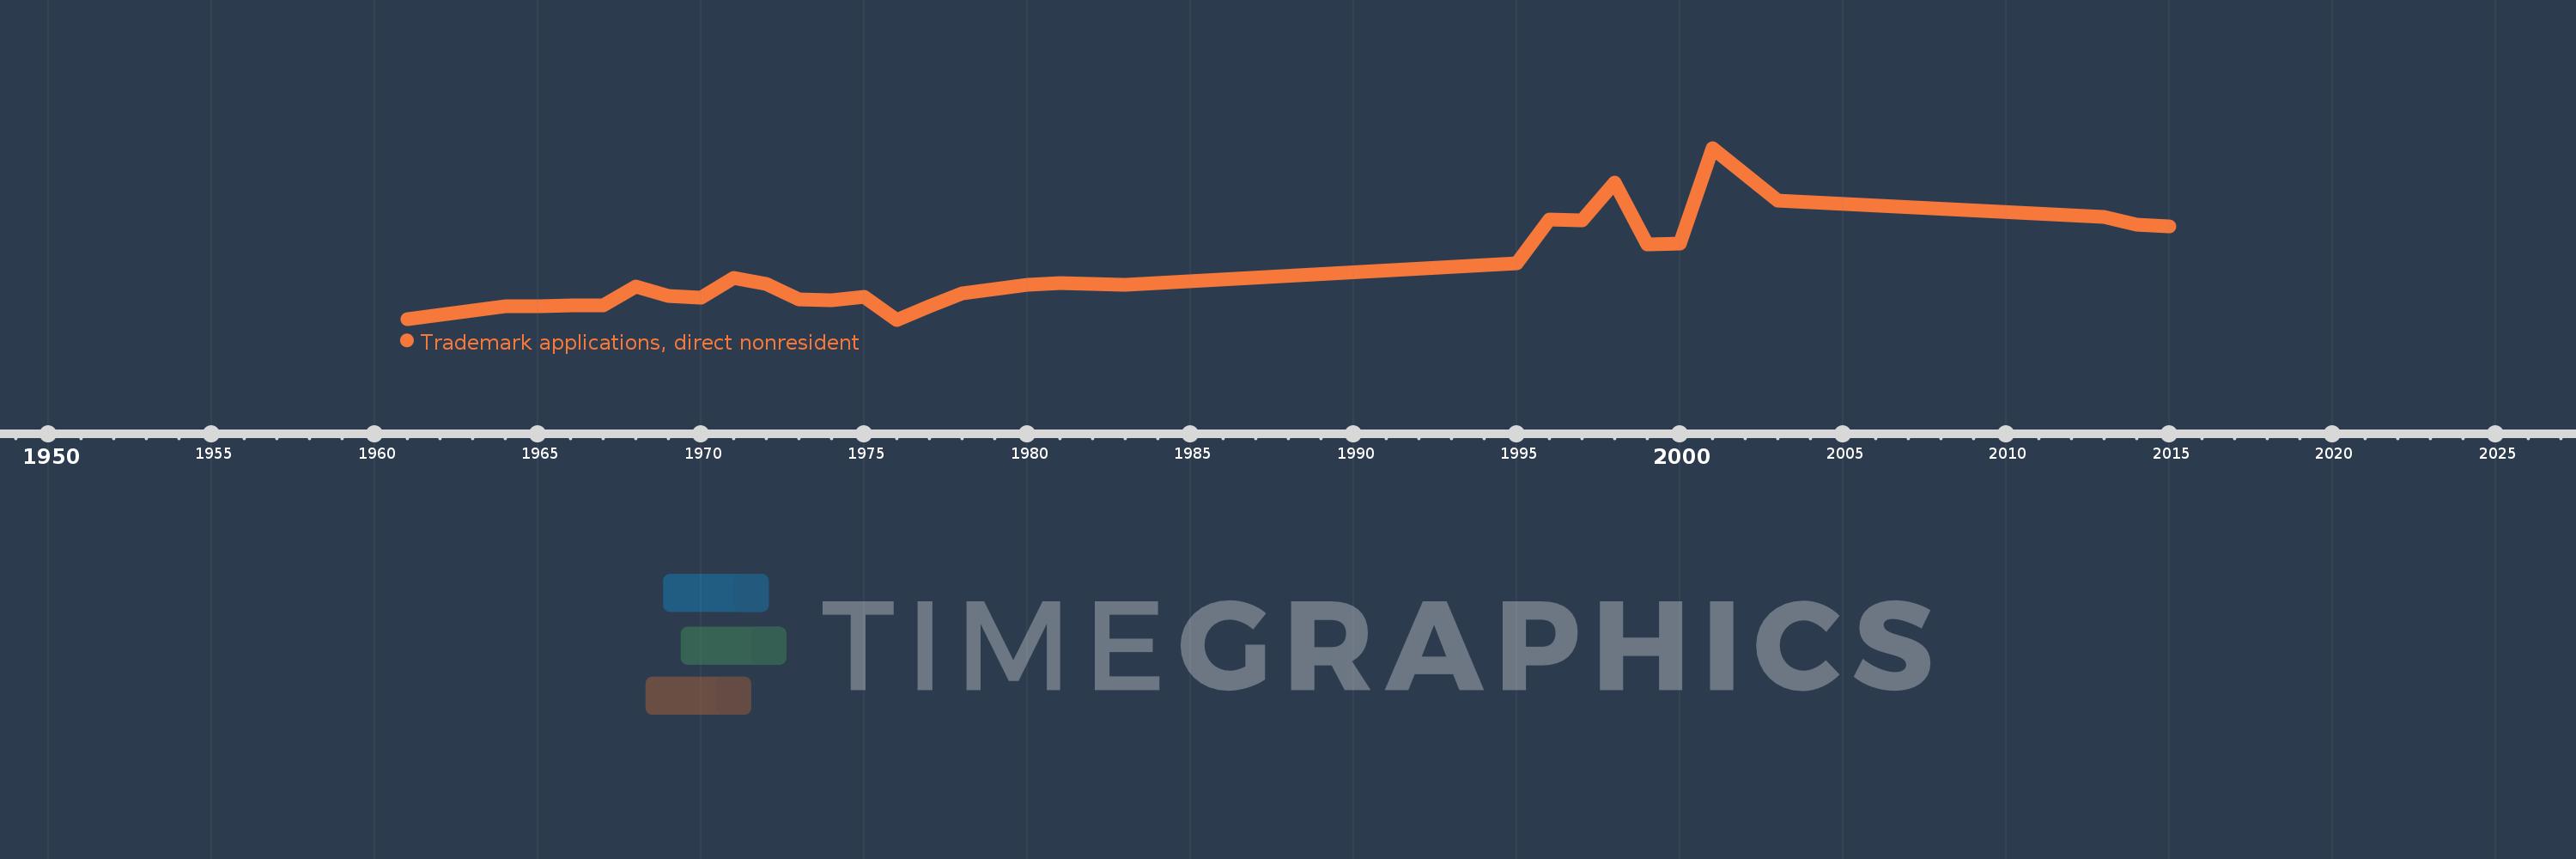
Trinidad and Tobago
TTO
true
2
1
Trademark applications, direct nonresident
2015,2014,2013,2003,2001,2000,1999,1998,1997,1996,1995,1983,1981,1980,1979,1978,1977,1976,1975,1974,1973,1972,1971,1970,1969,1968,1967,1966,1965,1964,1962,1961