33
/de/
AIzaSyB4mHJ5NPEv-XzF7P6NDYXjlkCWaeKw5bc
November 30, 2025
240079
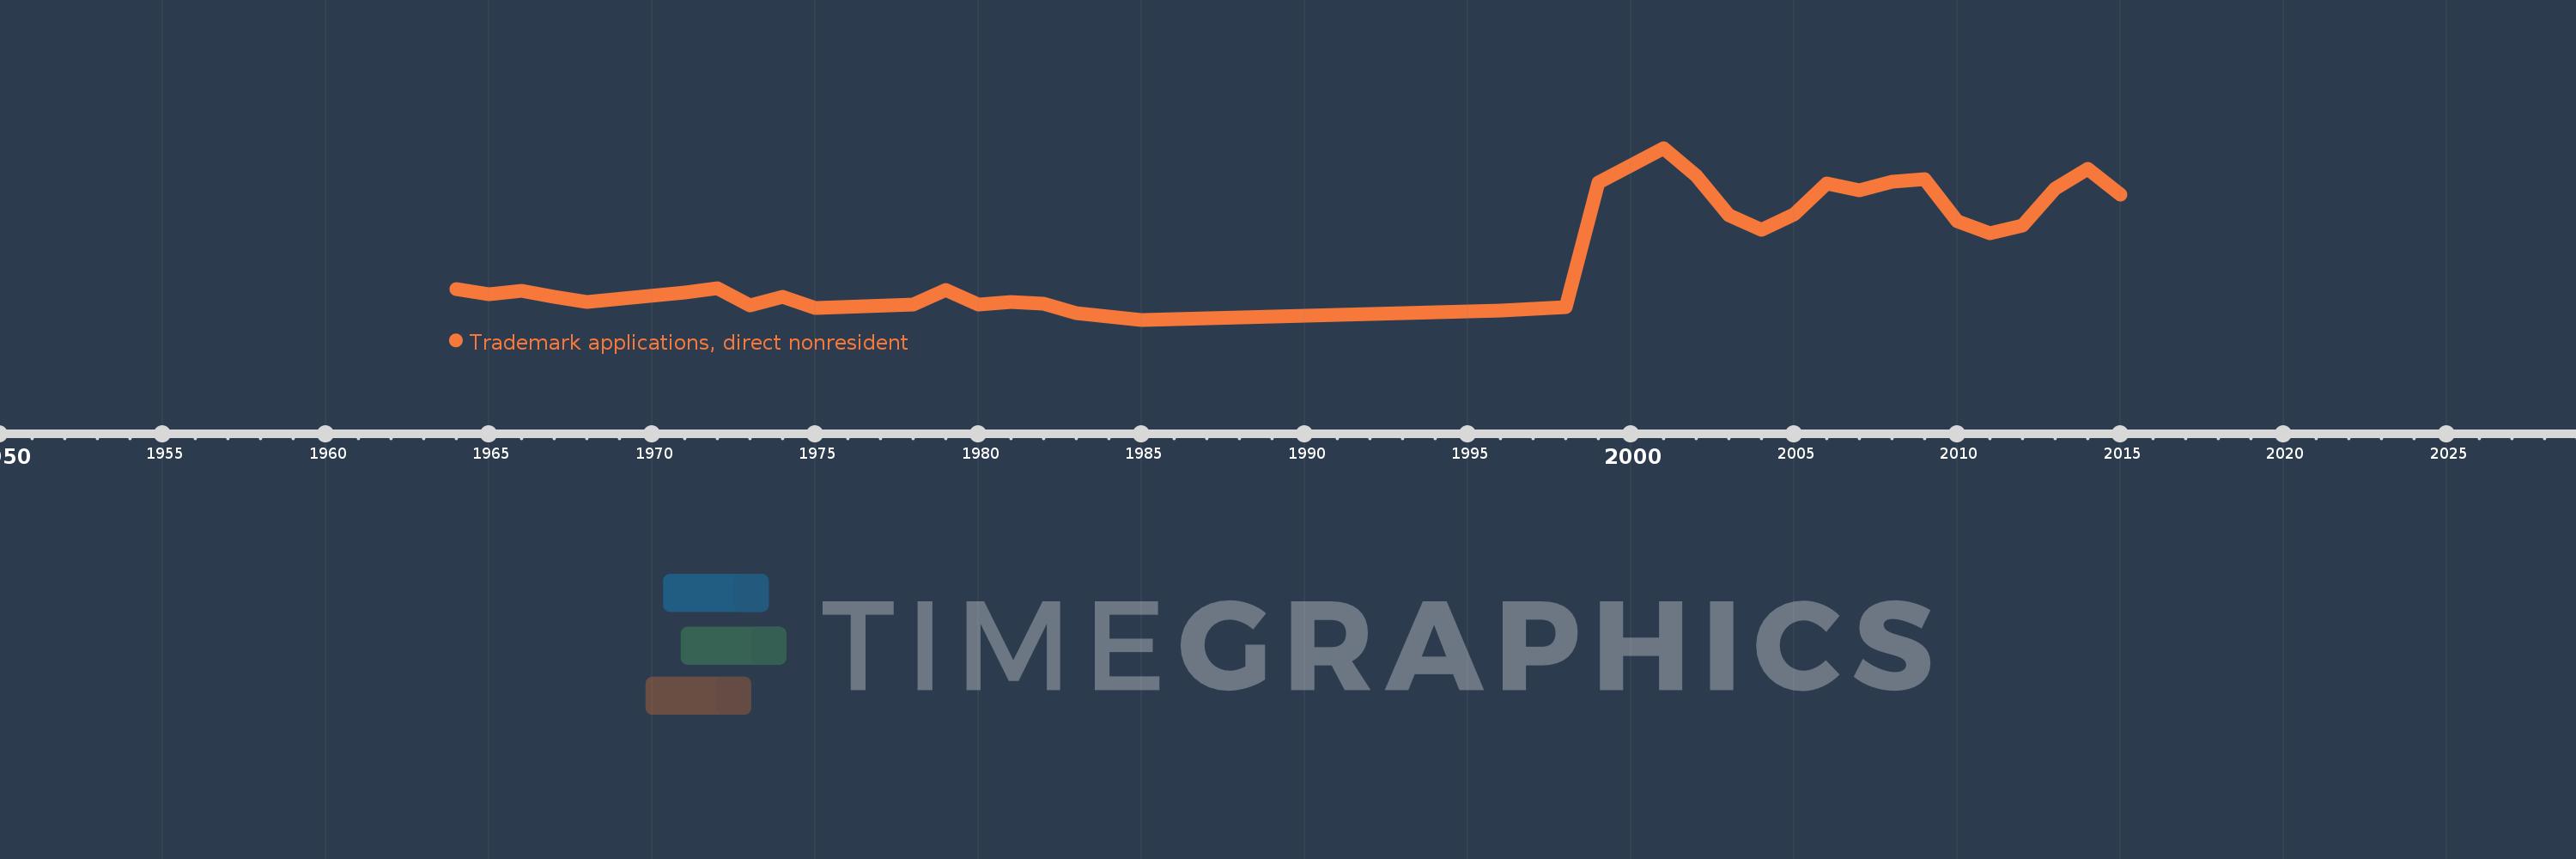
Sierra Leone
SLE
true
2
1
Trademark applications, direct nonresident
2015,2014,2013,2012,2011,2010,2009,2008,2007,2006,2005,2004,2003,2002,2001,1999,1998,1996,1985,1983,1982,1981,1980,1979,1978,1975,1974,1973,1972,1971,1968,1967,1966,1965,1964