33
/de/
AIzaSyB4mHJ5NPEv-XzF7P6NDYXjlkCWaeKw5bc
November 1, 2025
250123
St. Kitts and Nevis
KNA
true
2
1
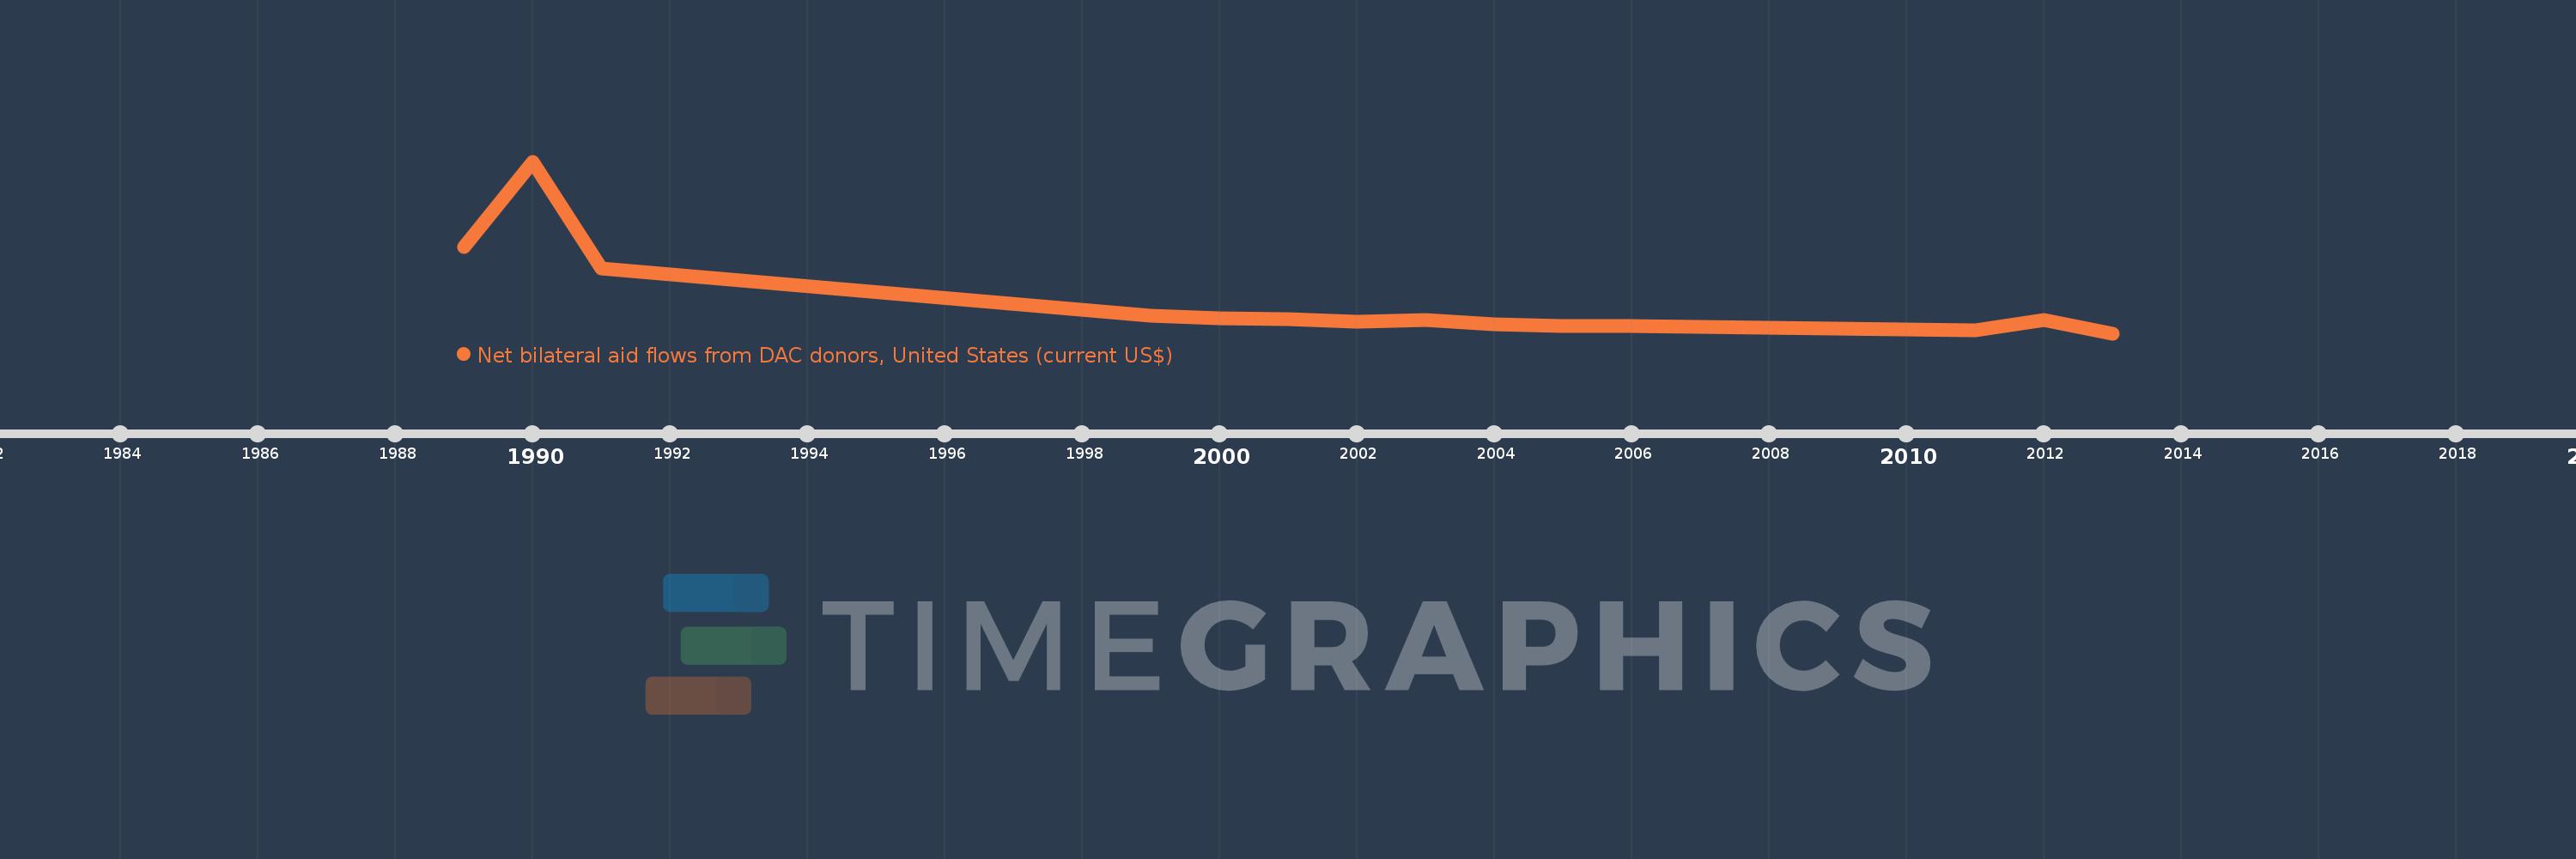
Net bilateral aid flows from DAC donors, United States (current US$)
2013,2012,2011,2010,2009,2008,2007,2006,2005,2004,2003,2002,2001,2000,1999,1991,1990,1989