29
/de/
de
AIzaSyAYiBZKx7MnpbEhh9jyipgxe19OcubqV5w
April 1, 2024
189305
Maldives
MDV
true
2
1
Net bilateral aid flows from DAC donors, United States (current US$)
2015,2014,2013,2011,2010,2009,2008,2007,2006,2005,2004,2003,2002,2001,2000,1999,1987,1986
Download
Bibliothek der Globalstatistik →Maldives →

Net bilateral aid flows from DAC donors, United States (current US$)

Diese Statistik in anderen Ländern:
AfghanistanAlbaniaAlgeriaAngolaAntigua and BarbudaArab WorldArgentinaArmeniaArubaAzerbaijanBahamas, TheBahrainBangladeshBarbadosBelarusBelizeBeninBermudaBhutanBoliviaBosnia and HerzegovinaBotswanaBrazilBritish Virgin IslandsBulgariaBurkina FasoBurundiCabo VerdeCambodiaCameroonCaribbean small statesCayman IslandsCentral African RepublicCentral Europe and the BalticsChadChileChinaColombiaComorosCongo, Dem. Rep.Congo, Rep.Costa RicaCote d'IvoireCroatiaCubaCyprusCzech RepublicDjiboutiDominicaDominican RepublicEast Asia & PacificEast Asia & Pacific (excluding high income)East Asia & Pacific (IDA & IBRD countries)EcuadorEgypt, Arab Rep.El SalvadorEquatorial GuineaEritreaEstoniaEthiopiaEuro areaEurope & Central AsiaEurope & Central Asia (excluding high income)Europe & Central Asia (IDA & IBRD countries)European UnionFijiFragile and conflict affected situationsGabonGambia, TheGeorgiaGhanaGrenadaGuatemalaGuineaGuinea-BissauGuyanaHaitiHeavily indebted poor countries (HIPC)High incomeHondurasHong Kong SAR, ChinaHungaryIBRD onlyIDA & IBRD totalIDA blendIDA onlyIDA totalIndiaIndonesiaIran, Islamic Rep.IraqIsraelJamaicaJordanKazakhstanKenyaKiribatiKorea, Dem. People’s Rep.Korea, Rep.KosovoKyrgyz RepublicLao PDRLatin America & Caribbean Latin America & Caribbean (excluding high income)Latin America & the Caribbean (IDA & IBRD countries)LatviaLeast developed countries: UN classificationLebanonLesothoLiberiaLibyaLithuaniaLow & middle incomeLow incomeLower middle incomeMacao SAR, ChinaMacedonia, FYRMadagascarMalawiMalaysiaMaldivesMaliMaltaMarshall IslandsMauritaniaMauritiusMexicoMicronesia, Fed. Sts.Middle East & North AfricaMiddle East & North Africa (excluding high income)Middle East & North Africa (IDA & IBRD countries)Middle incomeMoldovaMongoliaMontenegroMoroccoMozambiqueMyanmarNamibiaNepalNicaraguaNigerNigeriaNorth AmericaNorthern Mariana IslandsOECD membersOmanOther small statesPacific island small statesPakistanPalauPanamaPapua New GuineaParaguayPeruPhilippinesPolandQatarRomaniaRussian FederationRwandaSamoaSao Tome and PrincipeSaudi ArabiaSenegalSerbiaSeychellesSierra LeoneSingaporeSlovak RepublicSloveniaSmall statesSolomon IslandsSomaliaSouth AfricaSouth AsiaSouth Asia (IDA & IBRD)South SudanSri LankaSt. Kitts and NevisSt. LuciaSt. Vincent and the GrenadinesSub-Saharan Africa Sub-Saharan Africa (excluding high income)Sub-Saharan Africa (IDA & IBRD countries)SudanSurinameSwazilandSyrian Arab RepublicTajikistanTanzaniaThailandTimor-LesteTogoTongaTrinidad and TobagoTunisiaTurkeyTurkmenistanTurks and Caicos IslandsTuvaluUgandaUkraineUnited Arab EmiratesUpper middle incomeUruguayUzbekistanVanuatuVenezuela, RBVietnamWest Bank and GazaWorldYemen, Rep.ZambiaZimbabwe
Zeitlinie:
Diese Zeitleiste vorliegt die Graphik ab 1986 J. bis 2015 J. Maldives. Die Angaben bis 1985 J. sind nicht vorhanden. Die Zahl aktueller Beobachtungen nach Daten: 18.
Die Quelle (Bezeichnung):
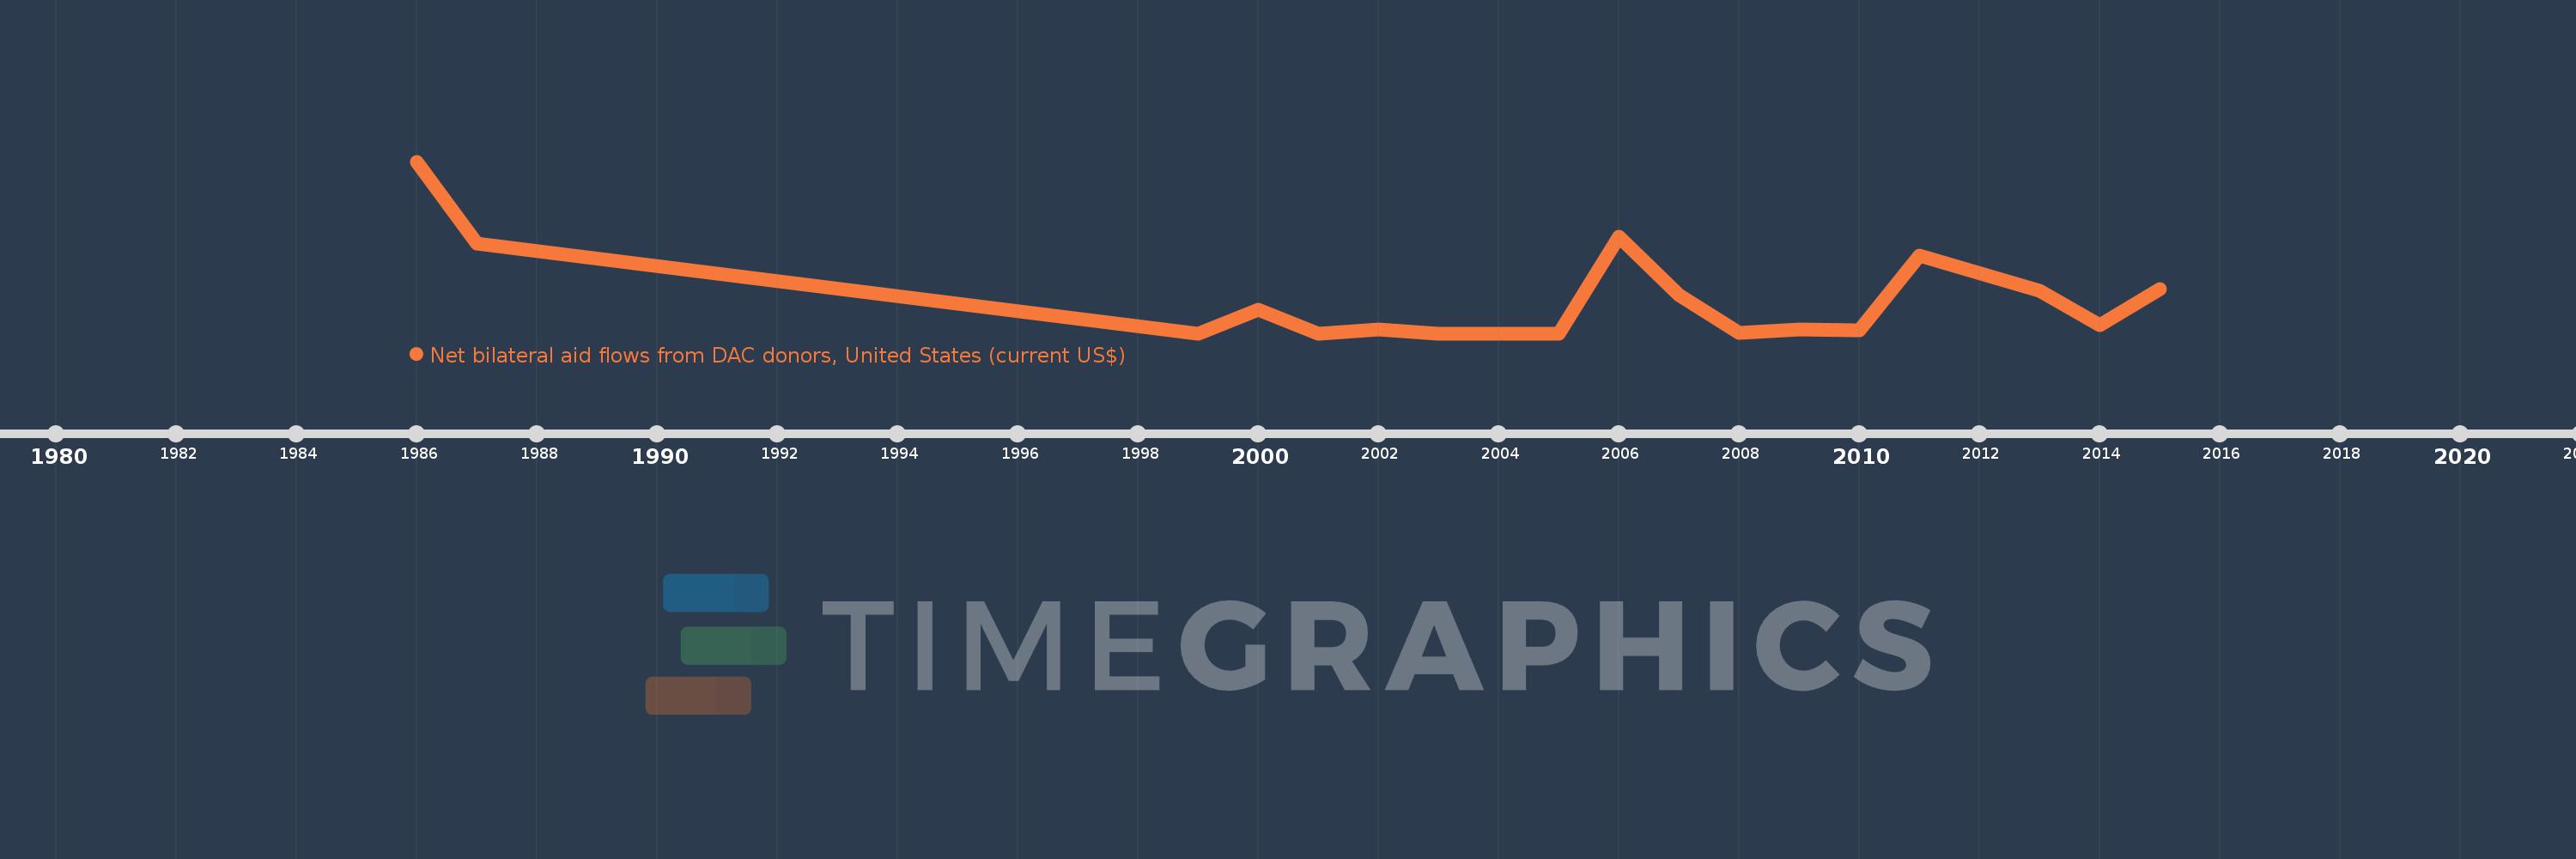
Kennzahlen der Weltentwicklung
Die Quelle (Einrichtung):
Development Assistance Committee of the Organisation for Economic Co-operation and Development, Geographical Distribution of Financial Flows to Developing Countries, Development Co-operation Report, and International Development Statistics database. Data are available online at: www.oecd.org/dac/stats/idsonline.
Kategorien:
Aid Effectiveness
Es wurde aktualisiert:
23 Apr 2017 Jahr
Kennzahlen der Wertänderungen vom Jahr zum Jahr
im Durchschnitt:
319.444 Tsnd.
Minimum:
-90.0 Tsnd.
1 Jan 1999 Jahr
Maximum:
2.0 Mln.
1 Jan 1986 Jahr
Zum Datum der Beobachtung
Wert
Absolute Veränderung
Die Veränderung bezüglich dem vorherigen Wert
1 Jan 1986 Jahr
2.0 Mln.
+2.0 Mln.
0.0%
1 Jan 1987 Jahr
1000.0 Tsnd.
-1000.0 Tsnd.
-50.0%
1 Jan 1999 Jahr
-90.0 Tsnd.
-1.09 Mln.
-109.0%
1 Jan 2000 Jahr
200.0 Tsnd.
+290.0 Tsnd.
-322.22%
1 Jan 2001 Jahr
-90.0 Tsnd.
-290.0 Tsnd.
-145.0%
1 Jan 2002 Jahr
-40.0 Tsnd.
+50.0 Tsnd.
-55.56%
1 Jan 2003 Jahr
-90.0 Tsnd.
-50.0 Tsnd.
125.0%
1 Jan 2004 Jahr
-90.0 Tsnd.
0.0
0.0%
1 Jan 2005 Jahr
-90.0 Tsnd.
0.0
0.0%
1 Jan 2006 Jahr
1.09 Mln.
+1.18 Mln.
-1.31 Tsnd.%
1 Jan 2007 Jahr
370.0 Tsnd.
-720.0 Tsnd.
-66.06%
1 Jan 2008 Jahr
-80.0 Tsnd.
-450.0 Tsnd.
-121.62%
1 Jan 2009 Jahr
-40.0 Tsnd.
+40.0 Tsnd.
-50.0%
1 Jan 2010 Jahr
-50.0 Tsnd.
-10.0 Tsnd.
25.0%
1 Jan 2011 Jahr
860.0 Tsnd.
+910.0 Tsnd.
-1.82 Tsnd.%
1 Jan 2013 Jahr
430.0 Tsnd.
-430.0 Tsnd.
-50.0%
1 Jan 2014 Jahr
10.0 Tsnd.
-420.0 Tsnd.
-97.67%
1 Jan 2015 Jahr
450.0 Tsnd.
+440.0 Tsnd.
4.4 Tsnd.%
Bewertung der Länder gemäß mit laufender Statistik nach Jahren

Kommentare:

Abschicken
PremiumAbout & FeedbackVereinbarungPrivatheit
logo
© 2022 Selected Technologies LLC – Morgan Hill, California