29
/de/
de
AIzaSyAYiBZKx7MnpbEhh9jyipgxe19OcubqV5w
April 1, 2024
238527
Seychelles
SYC
true
2
1
Net bilateral aid flows from DAC donors, Norway (current US$)
2005,2004,2002,1998,1997,1996,1995,1994,1993,1992,1991,1990,1989,1988,1987,1986,1985,1984,1979,1978
Download
Bibliothek der Globalstatistik →Seychelles →

Net bilateral aid flows from DAC donors, Norway (current US$)

Diese Statistik in anderen Ländern:
AfghanistanAlbaniaAlgeriaAngolaAntigua and BarbudaArab WorldArgentinaArmeniaAzerbaijanBahrainBangladeshBarbadosBelarusBelizeBeninBermudaBhutanBoliviaBosnia and HerzegovinaBotswanaBrazilBulgariaBurkina FasoBurundiCabo VerdeCambodiaCameroonCaribbean small statesCentral African RepublicCentral Europe and the BalticsChadChileChinaColombiaComorosCongo, Dem. Rep.Congo, Rep.Costa RicaCote d'IvoireCroatiaCubaCyprusCzech RepublicDjiboutiDominican RepublicEast Asia & PacificEast Asia & Pacific (excluding high income)East Asia & Pacific (IDA & IBRD countries)EcuadorEgypt, Arab Rep.El SalvadorEquatorial GuineaEritreaEstoniaEthiopiaEuro areaEurope & Central AsiaEurope & Central Asia (excluding high income)Europe & Central Asia (IDA & IBRD countries)European UnionFijiFragile and conflict affected situationsGabonGambia, TheGeorgiaGhanaGibraltarGrenadaGuatemalaGuineaGuinea-BissauGuyanaHaitiHeavily indebted poor countries (HIPC)High incomeHondurasHong Kong SAR, ChinaHungaryIBRD onlyIDA & IBRD totalIDA blendIDA onlyIDA totalIndiaIndonesiaIran, Islamic Rep.IraqIsraelJamaicaJordanKazakhstanKenyaKiribatiKorea, Dem. People’s Rep.Korea, Rep.KosovoKuwaitKyrgyz RepublicLao PDRLatin America & Caribbean Latin America & Caribbean (excluding high income)Latin America & the Caribbean (IDA & IBRD countries)LatviaLeast developed countries: UN classificationLebanonLesothoLiberiaLibyaLithuaniaLow & middle incomeLow incomeLower middle incomeMacao SAR, ChinaMacedonia, FYRMadagascarMalawiMalaysiaMaldivesMaliMaltaMarshall IslandsMauritaniaMauritiusMexicoMiddle East & North AfricaMiddle East & North Africa (excluding high income)Middle East & North Africa (IDA & IBRD countries)Middle incomeMoldovaMongoliaMontenegroMoroccoMozambiqueMyanmarNamibiaNauruNepalNicaraguaNigerNigeriaNorth AmericaOECD membersOmanOther small statesPacific island small statesPakistanPanamaPapua New GuineaParaguayPeruPhilippinesPolandRomaniaRussian FederationRwandaSamoaSao Tome and PrincipeSaudi ArabiaSenegalSerbiaSeychellesSierra LeoneSingaporeSlovak RepublicSloveniaSmall statesSolomon IslandsSomaliaSouth AfricaSouth AsiaSouth Asia (IDA & IBRD)South SudanSri LankaSt. Kitts and NevisSt. LuciaSt. Vincent and the GrenadinesSub-Saharan Africa Sub-Saharan Africa (excluding high income)Sub-Saharan Africa (IDA & IBRD countries)SudanSurinameSwazilandSyrian Arab RepublicTajikistanTanzaniaThailandTimor-LesteTogoTongaTrinidad and TobagoTunisiaTurkeyTurkmenistanUgandaUkraineUnited Arab EmiratesUpper middle incomeUruguayUzbekistanVanuatuVenezuela, RBVietnamWest Bank and GazaWorldYemen, Rep.ZambiaZimbabwe
Zeitlinie:
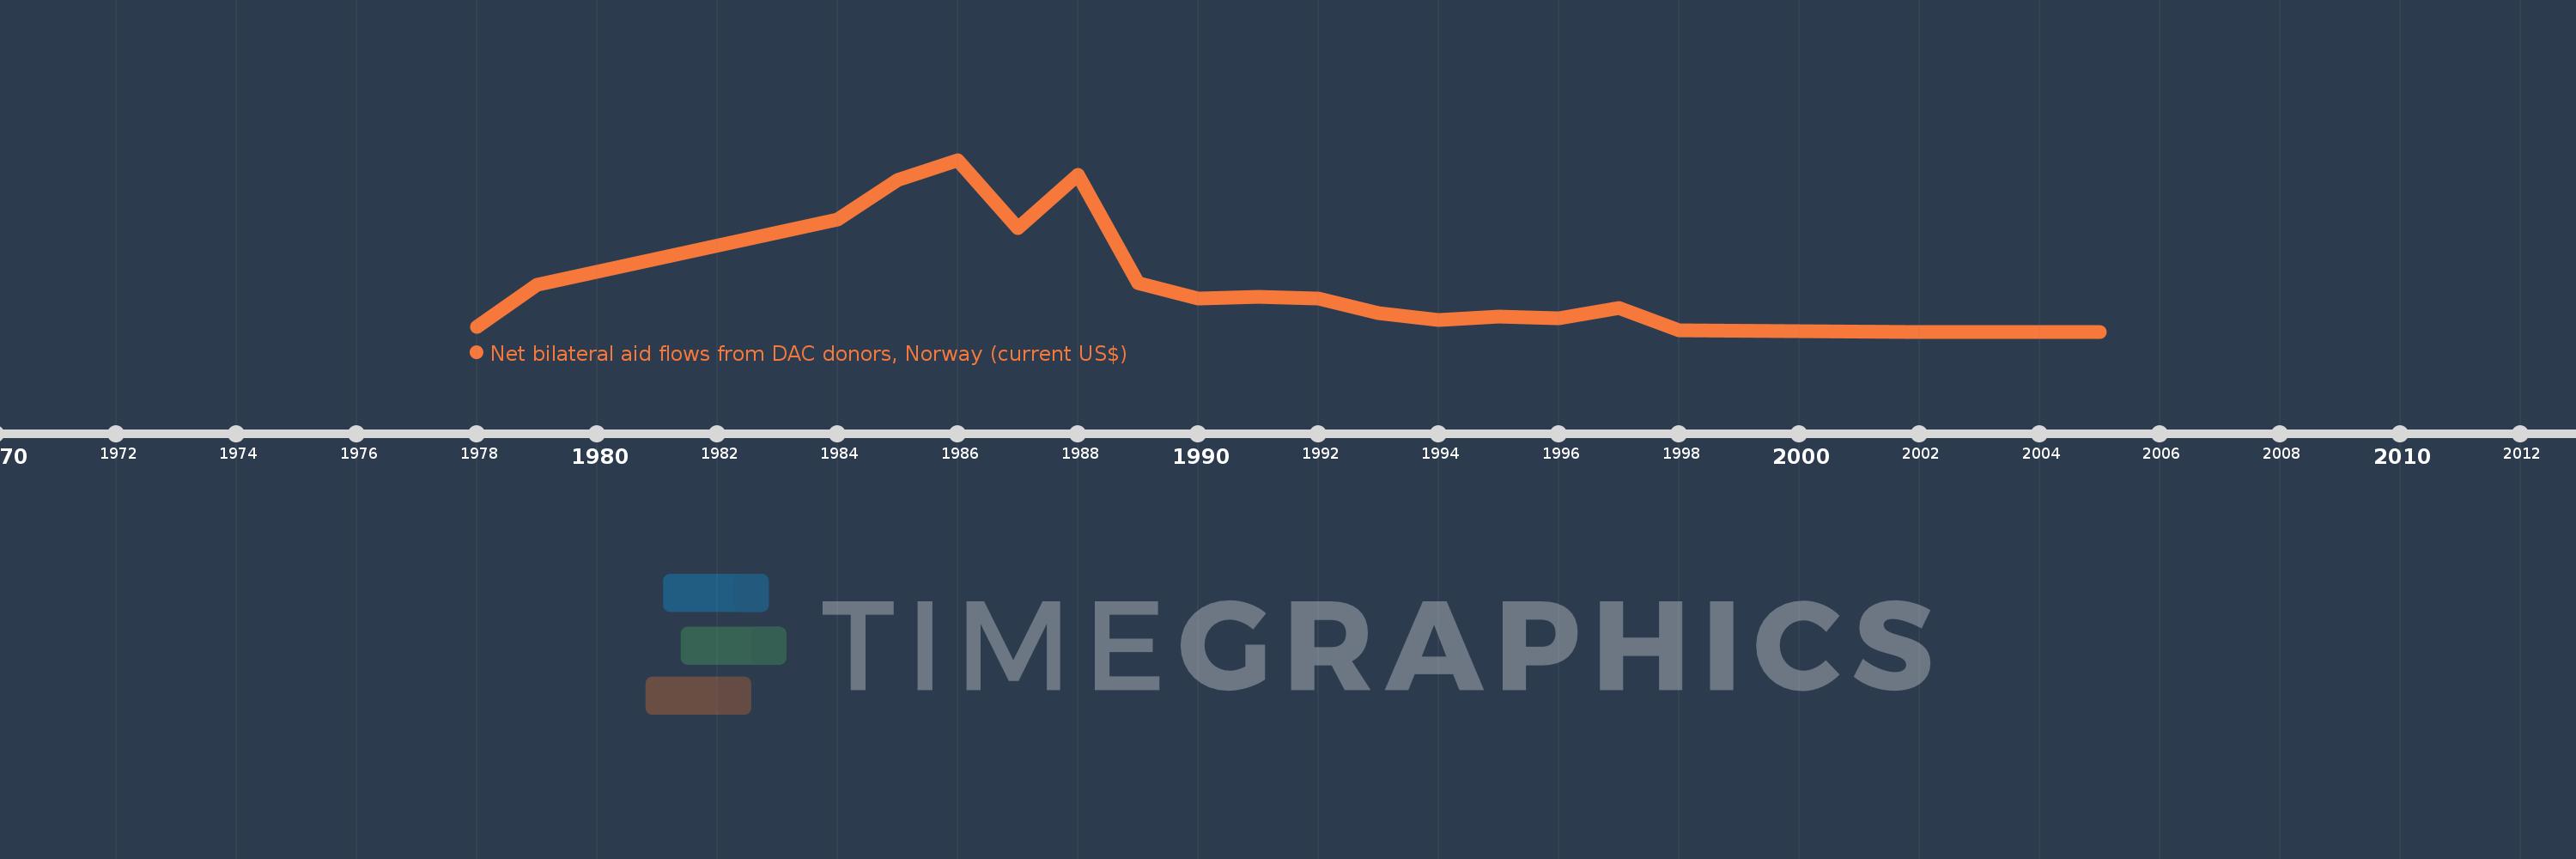
Diese Zeitleiste vorliegt die Graphik ab 1978 J. bis 2005 J. Seychelles. Die Angaben bis 1977 J. sind nicht vorhanden. Die Zahl aktueller Beobachtungen nach Daten: 20.
Die Quelle (Bezeichnung):
Kennzahlen der Weltentwicklung
Die Quelle (Einrichtung):
Development Assistance Committee of the Organisation for Economic Co-operation and Development, Geographical Distribution of Financial Flows to Developing Countries, Development Co-operation Report, and International Development Statistics database. Data are available online at: www.oecd.org/dac/stats/idsonline.
Kategorien:
Aid Effectiveness
Es wurde aktualisiert:
23 Apr 2017 Jahr
Kennzahlen der Wertänderungen vom Jahr zum Jahr
im Durchschnitt:
304.0 Tsnd.
Minimum:
10.0 Tsnd.
1 Jan 2002 Jahr
Maximum:
1.04 Mln.
1 Jan 1986 Jahr
Zum Datum der Beobachtung
Wert
Absolute Veränderung
Die Veränderung bezüglich dem vorherigen Wert
1 Jan 1978 Jahr
40.0 Tsnd.
+40.0 Tsnd.
0.0%
1 Jan 1979 Jahr
290.0 Tsnd.
+250.0 Tsnd.
625.0%
1 Jan 1984 Jahr
680.0 Tsnd.
+390.0 Tsnd.
134.48%
1 Jan 1985 Jahr
920.0 Tsnd.
+240.0 Tsnd.
35.29%
1 Jan 1986 Jahr
1.04 Mln.
+120.0 Tsnd.
13.04%
1 Jan 1987 Jahr
630.0 Tsnd.
-410.0 Tsnd.
-39.42%
1 Jan 1988 Jahr
950.0 Tsnd.
+320.0 Tsnd.
50.79%
1 Jan 1989 Jahr
300.0 Tsnd.
-650.0 Tsnd.
-68.42%
1 Jan 1990 Jahr
210.0 Tsnd.
-90.0 Tsnd.
-30.0%
1 Jan 1991 Jahr
220.0 Tsnd.
+10.0 Tsnd.
4.76%
1 Jan 1992 Jahr
210.0 Tsnd.
-10.0 Tsnd.
-4.55%
1 Jan 1993 Jahr
120.0 Tsnd.
-90.0 Tsnd.
-42.86%
1 Jan 1994 Jahr
80.0 Tsnd.
-40.0 Tsnd.
-33.33%
1 Jan 1995 Jahr
100.0 Tsnd.
+20.0 Tsnd.
25.0%
1 Jan 1996 Jahr
90.0 Tsnd.
-10.0 Tsnd.
-10.0%
1 Jan 1997 Jahr
150.0 Tsnd.
+60.0 Tsnd.
66.67%
1 Jan 1998 Jahr
20.0 Tsnd.
-130.0 Tsnd.
-86.67%
1 Jan 2002 Jahr
10.0 Tsnd.
-10.0 Tsnd.
-50.0%
1 Jan 2004 Jahr
10.0 Tsnd.
0.0
0.0%
1 Jan 2005 Jahr
10.0 Tsnd.
0.0
0.0%
Bewertung der Länder gemäß mit laufender Statistik nach Jahren

Kommentare:

Abschicken
PremiumAbout & FeedbackVereinbarungPrivatheit
logo
© 2022 Selected Technologies LLC – Morgan Hill, California