29
/de/
de
AIzaSyAYiBZKx7MnpbEhh9jyipgxe19OcubqV5w
April 1, 2024
102744
Central African Republic
CAF
true
2
1
Net bilateral aid flows from DAC donors, Norway (current US$)
2015,2014,2010,2009,2008,2007,2006,2005,2004,2001,2000,1999,1998,1997,1996,1995,1993
Download
Bibliothek der Globalstatistik →Central African Republic →

Net bilateral aid flows from DAC donors, Norway (current US$)

Diese Statistik in anderen Ländern:
AfghanistanAlbaniaAlgeriaAngolaAntigua and BarbudaArab WorldArgentinaArmeniaAzerbaijanBahrainBangladeshBarbadosBelarusBelizeBeninBermudaBhutanBoliviaBosnia and HerzegovinaBotswanaBrazilBulgariaBurkina FasoBurundiCabo VerdeCambodiaCameroonCaribbean small statesCentral African RepublicCentral Europe and the BalticsChadChileChinaColombiaComorosCongo, Dem. Rep.Congo, Rep.Costa RicaCote d'IvoireCroatiaCubaCyprusCzech RepublicDjiboutiDominican RepublicEast Asia & PacificEast Asia & Pacific (excluding high income)East Asia & Pacific (IDA & IBRD countries)EcuadorEgypt, Arab Rep.El SalvadorEquatorial GuineaEritreaEstoniaEthiopiaEuro areaEurope & Central AsiaEurope & Central Asia (excluding high income)Europe & Central Asia (IDA & IBRD countries)European UnionFijiFragile and conflict affected situationsGabonGambia, TheGeorgiaGhanaGibraltarGrenadaGuatemalaGuineaGuinea-BissauGuyanaHaitiHeavily indebted poor countries (HIPC)High incomeHondurasHong Kong SAR, ChinaHungaryIBRD onlyIDA & IBRD totalIDA blendIDA onlyIDA totalIndiaIndonesiaIran, Islamic Rep.IraqIsraelJamaicaJordanKazakhstanKenyaKiribatiKorea, Dem. People’s Rep.Korea, Rep.KosovoKuwaitKyrgyz RepublicLao PDRLatin America & Caribbean Latin America & Caribbean (excluding high income)Latin America & the Caribbean (IDA & IBRD countries)LatviaLeast developed countries: UN classificationLebanonLesothoLiberiaLibyaLithuaniaLow & middle incomeLow incomeLower middle incomeMacao SAR, ChinaMacedonia, FYRMadagascarMalawiMalaysiaMaldivesMaliMaltaMarshall IslandsMauritaniaMauritiusMexicoMiddle East & North AfricaMiddle East & North Africa (excluding high income)Middle East & North Africa (IDA & IBRD countries)Middle incomeMoldovaMongoliaMontenegroMoroccoMozambiqueMyanmarNamibiaNauruNepalNicaraguaNigerNigeriaNorth AmericaOECD membersOmanOther small statesPacific island small statesPakistanPanamaPapua New GuineaParaguayPeruPhilippinesPolandRomaniaRussian FederationRwandaSamoaSao Tome and PrincipeSaudi ArabiaSenegalSerbiaSeychellesSierra LeoneSingaporeSlovak RepublicSloveniaSmall statesSolomon IslandsSomaliaSouth AfricaSouth AsiaSouth Asia (IDA & IBRD)South SudanSri LankaSt. Kitts and NevisSt. LuciaSt. Vincent and the GrenadinesSub-Saharan Africa Sub-Saharan Africa (excluding high income)Sub-Saharan Africa (IDA & IBRD countries)SudanSurinameSwazilandSyrian Arab RepublicTajikistanTanzaniaThailandTimor-LesteTogoTongaTrinidad and TobagoTunisiaTurkeyTurkmenistanUgandaUkraineUnited Arab EmiratesUpper middle incomeUruguayUzbekistanVanuatuVenezuela, RBVietnamWest Bank and GazaWorldYemen, Rep.ZambiaZimbabwe
Zeitlinie:
Diese Zeitleiste vorliegt die Graphik ab 1993 J. bis 2015 J. Central African Republic. Die Angaben bis 1992 J. sind nicht vorhanden. Die Zahl aktueller Beobachtungen nach Daten: 17.
Die Quelle (Bezeichnung):
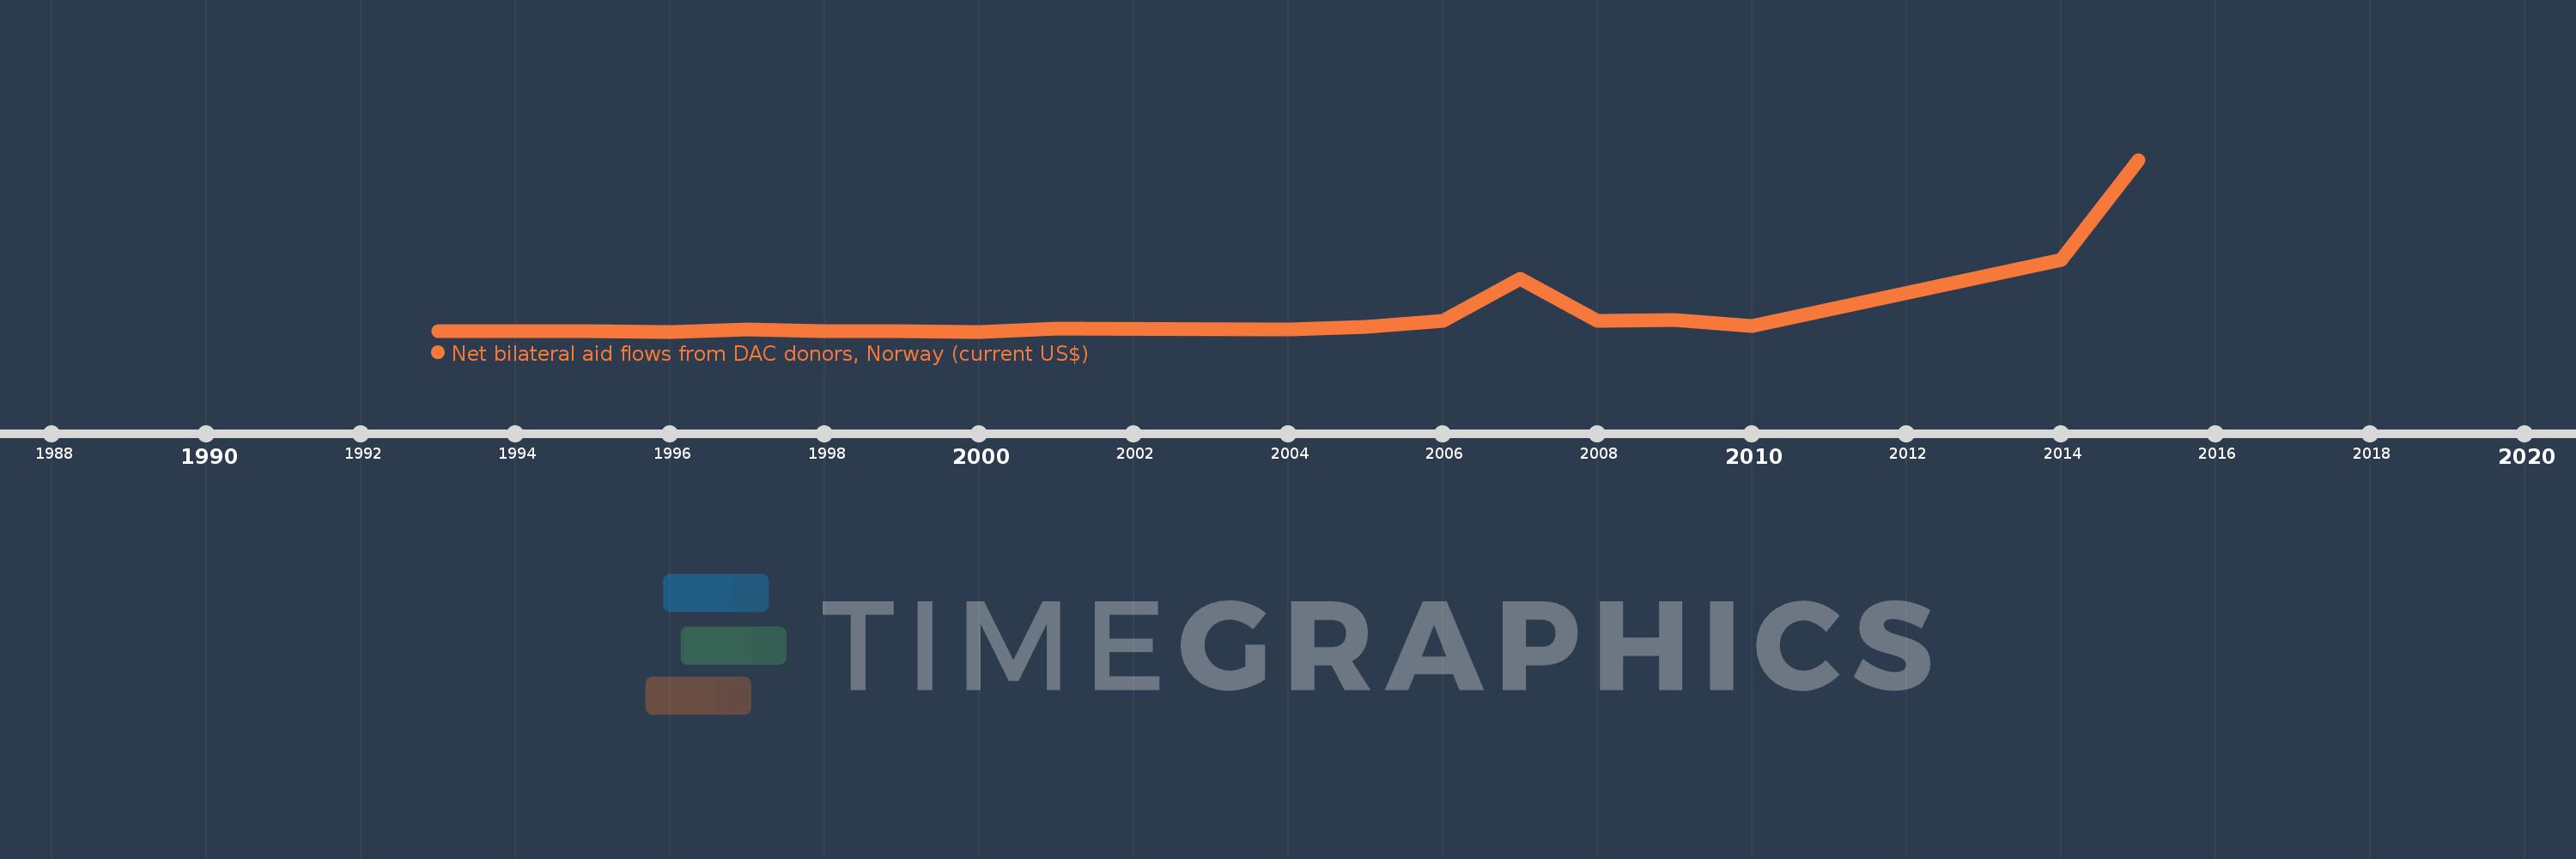
Kennzahlen der Weltentwicklung
Die Quelle (Einrichtung):
Development Assistance Committee of the Organisation for Economic Co-operation and Development, Geographical Distribution of Financial Flows to Developing Countries, Development Co-operation Report, and International Development Statistics database. Data are available online at: www.oecd.org/dac/stats/idsonline.
Kategorien:
Aid Effectiveness
Es wurde aktualisiert:
23 Apr 2017 Jahr
Kennzahlen der Wertänderungen vom Jahr zum Jahr
im Durchschnitt:
2.204 Mln.
Minimum:
10.0 Tsnd.
1 Jan 1996 Jahr
Maximum:
18.46 Mln.
1 Jan 2015 Jahr
Zum Datum der Beobachtung
Wert
Absolute Veränderung
Die Veränderung bezüglich dem vorherigen Wert
1 Jan 1993 Jahr
30.0 Tsnd.
+30.0 Tsnd.
0.0%
1 Jan 1995 Jahr
20.0 Tsnd.
-10.0 Tsnd.
-33.33%
1 Jan 1996 Jahr
10.0 Tsnd.
-10.0 Tsnd.
-50.0%
1 Jan 1997 Jahr
270.0 Tsnd.
+260.0 Tsnd.
2.6 Tsnd.%
1 Jan 1998 Jahr
60.0 Tsnd.
-210.0 Tsnd.
-77.78%
1 Jan 1999 Jahr
20.0 Tsnd.
-40.0 Tsnd.
-66.67%
1 Jan 2000 Jahr
10.0 Tsnd.
-10.0 Tsnd.
-50.0%
1 Jan 2001 Jahr
320.0 Tsnd.
+310.0 Tsnd.
3.1 Tsnd.%
1 Jan 2004 Jahr
220.0 Tsnd.
-100.0 Tsnd.
-31.25%
1 Jan 2005 Jahr
490.0 Tsnd.
+270.0 Tsnd.
122.73%
1 Jan 2006 Jahr
1.2 Mln.
+710.0 Tsnd.
144.9%
1 Jan 2007 Jahr
5.64 Mln.
+4.44 Mln.
370.0%
1 Jan 2008 Jahr
1.15 Mln.
-4.49 Mln.
-79.61%
1 Jan 2009 Jahr
1.23 Mln.
+80.0 Tsnd.
6.96%
1 Jan 2010 Jahr
640.0 Tsnd.
-590.0 Tsnd.
-47.97%
1 Jan 2014 Jahr
7.7 Mln.
+7.06 Mln.
1.1 Tsnd.%
1 Jan 2015 Jahr
18.46 Mln.
+10.76 Mln.
139.74%
Bewertung der Länder gemäß mit laufender Statistik nach Jahren

Kommentare:

Abschicken
PremiumAbout & FeedbackVereinbarungPrivatheit
logo
© 2022 Selected Technologies LLC – Morgan Hill, California