33
/de/
AIzaSyAYiBZKx7MnpbEhh9jyipgxe19OcubqV5w
August 1, 2025
209494
New Zealand
NZL
true
2
1
Labor force, total
2015,2014,2013,2012,2011,2010,2009,2008,2007,2006,2005,2004,2003,2002,2001,2000,1999,1998,1997,1996,1995,1994,1993,1992,1991
Download
Bibliothek der Globalstatistik →New Zealand →

Labor force, total

Diese Statistik in anderen Ländern:

AfghanistanAlbaniaAlgeriaAngolaArab WorldArgentinaArmeniaAustraliaAustriaAzerbaijanBahamas, TheBahrainBangladeshBarbadosBelarusBelgiumBelizeBeninBhutanBoliviaBosnia and HerzegovinaBotswanaBrazilBrunei DarussalamBulgariaBurkina FasoBurundiCabo VerdeCambodiaCameroonCanadaCaribbean small statesCentral African RepublicCentral Europe and the BalticsChadChannel IslandsChileChinaColombiaComorosCongo, Dem. Rep.Congo, Rep.Costa RicaCote d'IvoireCroatiaCubaCyprusCzech RepublicDenmarkDjiboutiDominican RepublicEarly-demographic dividendEast Asia & PacificEast Asia & Pacific (excluding high income)East Asia & Pacific (IDA & IBRD countries)EcuadorEgypt, Arab Rep.El SalvadorEquatorial GuineaEritreaEstoniaEthiopiaEuro areaEurope & Central AsiaEurope & Central Asia (excluding high income)Europe & Central Asia (IDA & IBRD countries)European UnionFijiFinlandFragile and conflict affected situationsFranceFrench PolynesiaGabonGambia, TheGeorgiaGermanyGhanaGreeceGuamGuatemalaGuineaGuinea-BissauGuyanaHaitiHeavily indebted poor countries (HIPC)High incomeHondurasHong Kong SAR, ChinaHungaryIBRD onlyIcelandIDA & IBRD totalIDA blendIDA onlyIDA totalIndiaIndonesiaIran, Islamic Rep.IraqIrelandIsraelItalyJamaicaJapanJordanKazakhstanKenyaKorea, Dem. People’s Rep.Korea, Rep.KuwaitKyrgyz RepublicLao PDRLate-demographic dividendLatin America & Caribbean Latin America & Caribbean (excluding high income)Latin America & the Caribbean (IDA & IBRD countries)LatviaLeast developed countries: UN classificationLebanonLesothoLiberiaLibyaLithuaniaLow & middle incomeLow incomeLower middle incomeLuxembourgMacao SAR, ChinaMacedonia, FYRMadagascarMalawiMalaysiaMaldivesMaliMaltaMauritaniaMauritiusMexicoMiddle East & North AfricaMiddle East & North Africa (excluding high income)Middle East & North Africa (IDA & IBRD countries)Middle incomeMoldovaMongoliaMontenegroMoroccoMozambiqueMyanmarNamibiaNepalNetherlandsNew CaledoniaNew ZealandNicaraguaNigerNigeriaNorth AmericaNorwayOECD membersOmanOther small statesPacific island small statesPakistanPanamaPapua New GuineaParaguayPeruPhilippinesPolandPortugalPost-demographic dividendPre-demographic dividendPuerto RicoQatarRomaniaRussian FederationRwandaSamoaSao Tome and PrincipeSaudi ArabiaSenegalSerbiaSierra LeoneSingaporeSlovak RepublicSloveniaSmall statesSolomon IslandsSomaliaSouth AfricaSouth AsiaSouth Asia (IDA & IBRD)SpainSri LankaSt. LuciaSt. Vincent and the GrenadinesSub-Saharan Africa Sub-Saharan Africa (excluding high income)Sub-Saharan Africa (IDA & IBRD countries)SudanSurinameSwazilandSwedenSwitzerlandSyrian Arab RepublicTajikistanTanzaniaThailandTimor-LesteTogoTongaTrinidad and TobagoTunisiaTurkeyTurkmenistanUgandaUkraineUnited Arab EmiratesUnited KingdomUnited StatesUpper middle incomeUruguayUzbekistanVanuatuVenezuela, RBVietnamVirgin Islands (U.S.)West Bank and GazaWorldYemen, Rep.ZambiaZimbabwe

Zeitlinie:

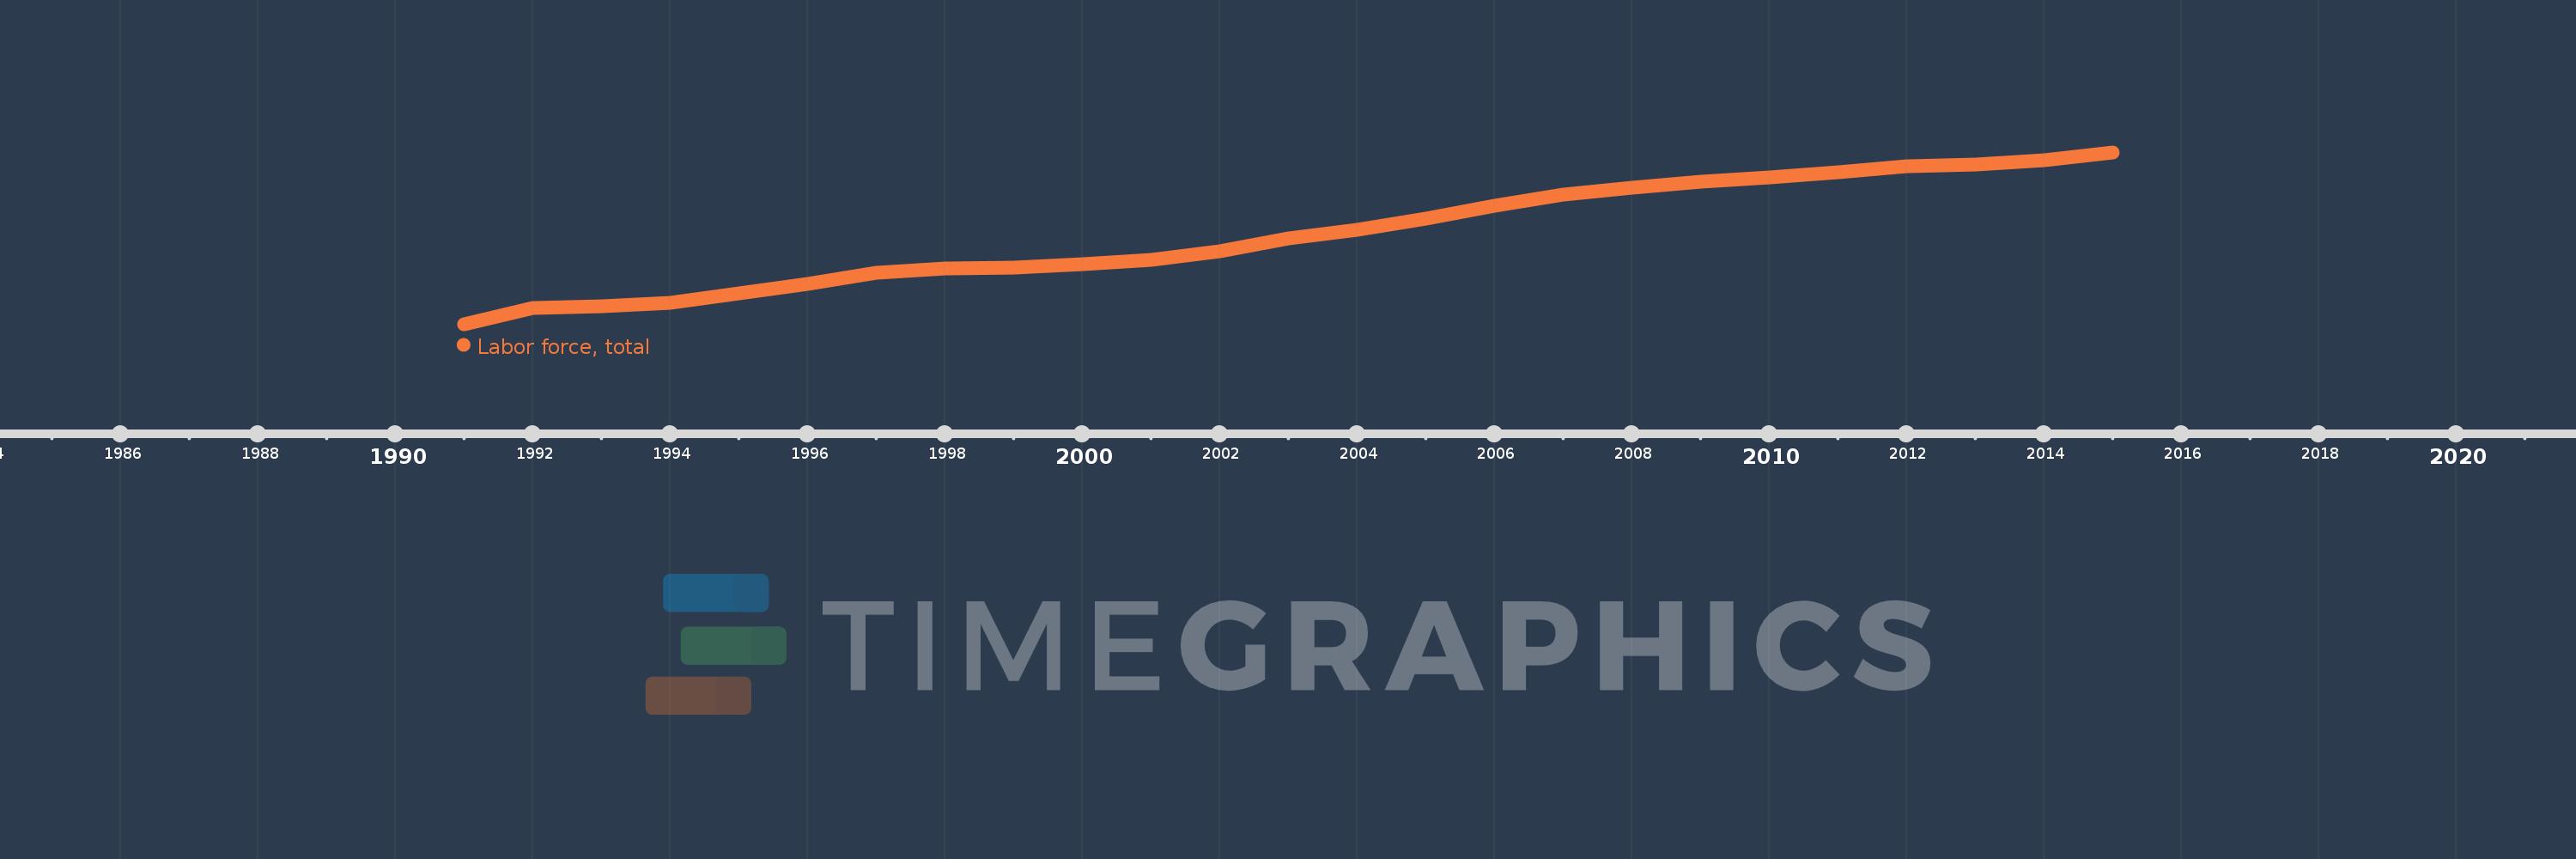
Diese Zeitleiste vorliegt die Graphik ab 1991 J. bis 2015 J. New Zealand. Die Angaben bis 1990 J. sind nicht vorhanden. Die Zahl aktueller Beobachtungen nach Daten: 25.

Die Quelle (Bezeichnung):

Kennzahlen der Weltentwicklung

Die Quelle (Einrichtung):

International Labour Organization, using World Bank population estimates.

Kategorien:

Education, Social Protection & Labor

Es wurde aktualisiert:

23 Apr 2017 Jahr

Kennzahlen der Wertänderungen vom Jahr zum Jahr

im Durchschnitt:
2.051 Mln.
Minimum:
1.628 Mln.
1 Jan 1991 Jahr
Maximum:
2.434 Mln.
1 Jan 2015 Jahr
Zum Datum der Beobachtung
Wert
Absolute Veränderung
Die Veränderung bezüglich dem vorherigen Wert
1 Jan 1991 Jahr
1.628 Mln.
+1.628 Mln.
0.0%
1 Jan 1992 Jahr
1.702 Mln.
+74.391 Tsnd.
4.57%
1 Jan 1993 Jahr
1.71 Mln.
+7.943 Tsnd.
0.47%
1 Jan 1994 Jahr
1.728 Mln.
+17.438 Tsnd.
1.02%
1 Jan 1995 Jahr
1.774 Mln.
+46.048 Tsnd.
2.67%
1 Jan 1996 Jahr
1.818 Mln.
+44.216 Tsnd.
2.49%
1 Jan 1997 Jahr
1.87 Mln.
+51.517 Tsnd.
2.83%
1 Jan 1998 Jahr
1.888 Mln.
+18.96 Tsnd.
1.01%
1 Jan 1999 Jahr
1.895 Mln.
+6.438 Tsnd.
0.34%
1 Jan 2000 Jahr
1.911 Mln.
+15.587 Tsnd.
0.82%
1 Jan 2001 Jahr
1.931 Mln.
+20.692 Tsnd.
1.08%
1 Jan 2002 Jahr
1.97 Mln.
+38.371 Tsnd.
1.99%
1 Jan 2003 Jahr
2.031 Mln.
+61.656 Tsnd.
3.13%
1 Jan 2004 Jahr
2.071 Mln.
+40.159 Tsnd.
1.98%
1 Jan 2005 Jahr
2.125 Mln.
+53.543 Tsnd.
2.58%
1 Jan 2006 Jahr
2.182 Mln.
+57.241 Tsnd.
2.69%
1 Jan 2007 Jahr
2.235 Mln.
+53.076 Tsnd.
2.43%
1 Jan 2008 Jahr
2.269 Mln.
+33.888 Tsnd.
1.52%
1 Jan 2009 Jahr
2.294 Mln.
+25.292 Tsnd.
1.11%
1 Jan 2010 Jahr
2.316 Mln.
+22.039 Tsnd.
0.96%
1 Jan 2011 Jahr
2.341 Mln.
+24.884 Tsnd.
1.07%
1 Jan 2012 Jahr
2.369 Mln.
+27.833 Tsnd.
1.19%
1 Jan 2013 Jahr
2.377 Mln.
+7.443 Tsnd.
0.31%
1 Jan 2014 Jahr
2.398 Mln.
+21.034 Tsnd.
0.89%
1 Jan 2015 Jahr
2.434 Mln.
+35.857 Tsnd.
1.5%

Bewertung der Länder gemäß mit laufender Statistik nach Jahren