33
/de/
AIzaSyAYiBZKx7MnpbEhh9jyipgxe19OcubqV5w
August 1, 2025
182271
Luxembourg
LUX
true
2
1
Labor force, total
2015,2014,2013,2012,2011,2010,2009,2008,2007,2006,2005,2004,2003,2002,2001,2000,1999,1998,1997,1996,1995,1994,1993,1992,1991
Download
Bibliothek der Globalstatistik →Luxembourg →

Labor force, total

Diese Statistik in anderen Ländern:

AfghanistanAlbaniaAlgeriaAngolaArab WorldArgentinaArmeniaAustraliaAustriaAzerbaijanBahamas, TheBahrainBangladeshBarbadosBelarusBelgiumBelizeBeninBhutanBoliviaBosnia and HerzegovinaBotswanaBrazilBrunei DarussalamBulgariaBurkina FasoBurundiCabo VerdeCambodiaCameroonCanadaCaribbean small statesCentral African RepublicCentral Europe and the BalticsChadChannel IslandsChileChinaColombiaComorosCongo, Dem. Rep.Congo, Rep.Costa RicaCote d'IvoireCroatiaCubaCyprusCzech RepublicDenmarkDjiboutiDominican RepublicEarly-demographic dividendEast Asia & PacificEast Asia & Pacific (excluding high income)East Asia & Pacific (IDA & IBRD countries)EcuadorEgypt, Arab Rep.El SalvadorEquatorial GuineaEritreaEstoniaEthiopiaEuro areaEurope & Central AsiaEurope & Central Asia (excluding high income)Europe & Central Asia (IDA & IBRD countries)European UnionFijiFinlandFragile and conflict affected situationsFranceFrench PolynesiaGabonGambia, TheGeorgiaGermanyGhanaGreeceGuamGuatemalaGuineaGuinea-BissauGuyanaHaitiHeavily indebted poor countries (HIPC)High incomeHondurasHong Kong SAR, ChinaHungaryIBRD onlyIcelandIDA & IBRD totalIDA blendIDA onlyIDA totalIndiaIndonesiaIran, Islamic Rep.IraqIrelandIsraelItalyJamaicaJapanJordanKazakhstanKenyaKorea, Dem. People’s Rep.Korea, Rep.KuwaitKyrgyz RepublicLao PDRLate-demographic dividendLatin America & Caribbean Latin America & Caribbean (excluding high income)Latin America & the Caribbean (IDA & IBRD countries)LatviaLeast developed countries: UN classificationLebanonLesothoLiberiaLibyaLithuaniaLow & middle incomeLow incomeLower middle incomeLuxembourgMacao SAR, ChinaMacedonia, FYRMadagascarMalawiMalaysiaMaldivesMaliMaltaMauritaniaMauritiusMexicoMiddle East & North AfricaMiddle East & North Africa (excluding high income)Middle East & North Africa (IDA & IBRD countries)Middle incomeMoldovaMongoliaMontenegroMoroccoMozambiqueMyanmarNamibiaNepalNetherlandsNew CaledoniaNew ZealandNicaraguaNigerNigeriaNorth AmericaNorwayOECD membersOmanOther small statesPacific island small statesPakistanPanamaPapua New GuineaParaguayPeruPhilippinesPolandPortugalPost-demographic dividendPre-demographic dividendPuerto RicoQatarRomaniaRussian FederationRwandaSamoaSao Tome and PrincipeSaudi ArabiaSenegalSerbiaSierra LeoneSingaporeSlovak RepublicSloveniaSmall statesSolomon IslandsSomaliaSouth AfricaSouth AsiaSouth Asia (IDA & IBRD)SpainSri LankaSt. LuciaSt. Vincent and the GrenadinesSub-Saharan Africa Sub-Saharan Africa (excluding high income)Sub-Saharan Africa (IDA & IBRD countries)SudanSurinameSwazilandSwedenSwitzerlandSyrian Arab RepublicTajikistanTanzaniaThailandTimor-LesteTogoTongaTrinidad and TobagoTunisiaTurkeyTurkmenistanUgandaUkraineUnited Arab EmiratesUnited KingdomUnited StatesUpper middle incomeUruguayUzbekistanVanuatuVenezuela, RBVietnamVirgin Islands (U.S.)West Bank and GazaWorldYemen, Rep.ZambiaZimbabwe

Zeitlinie:

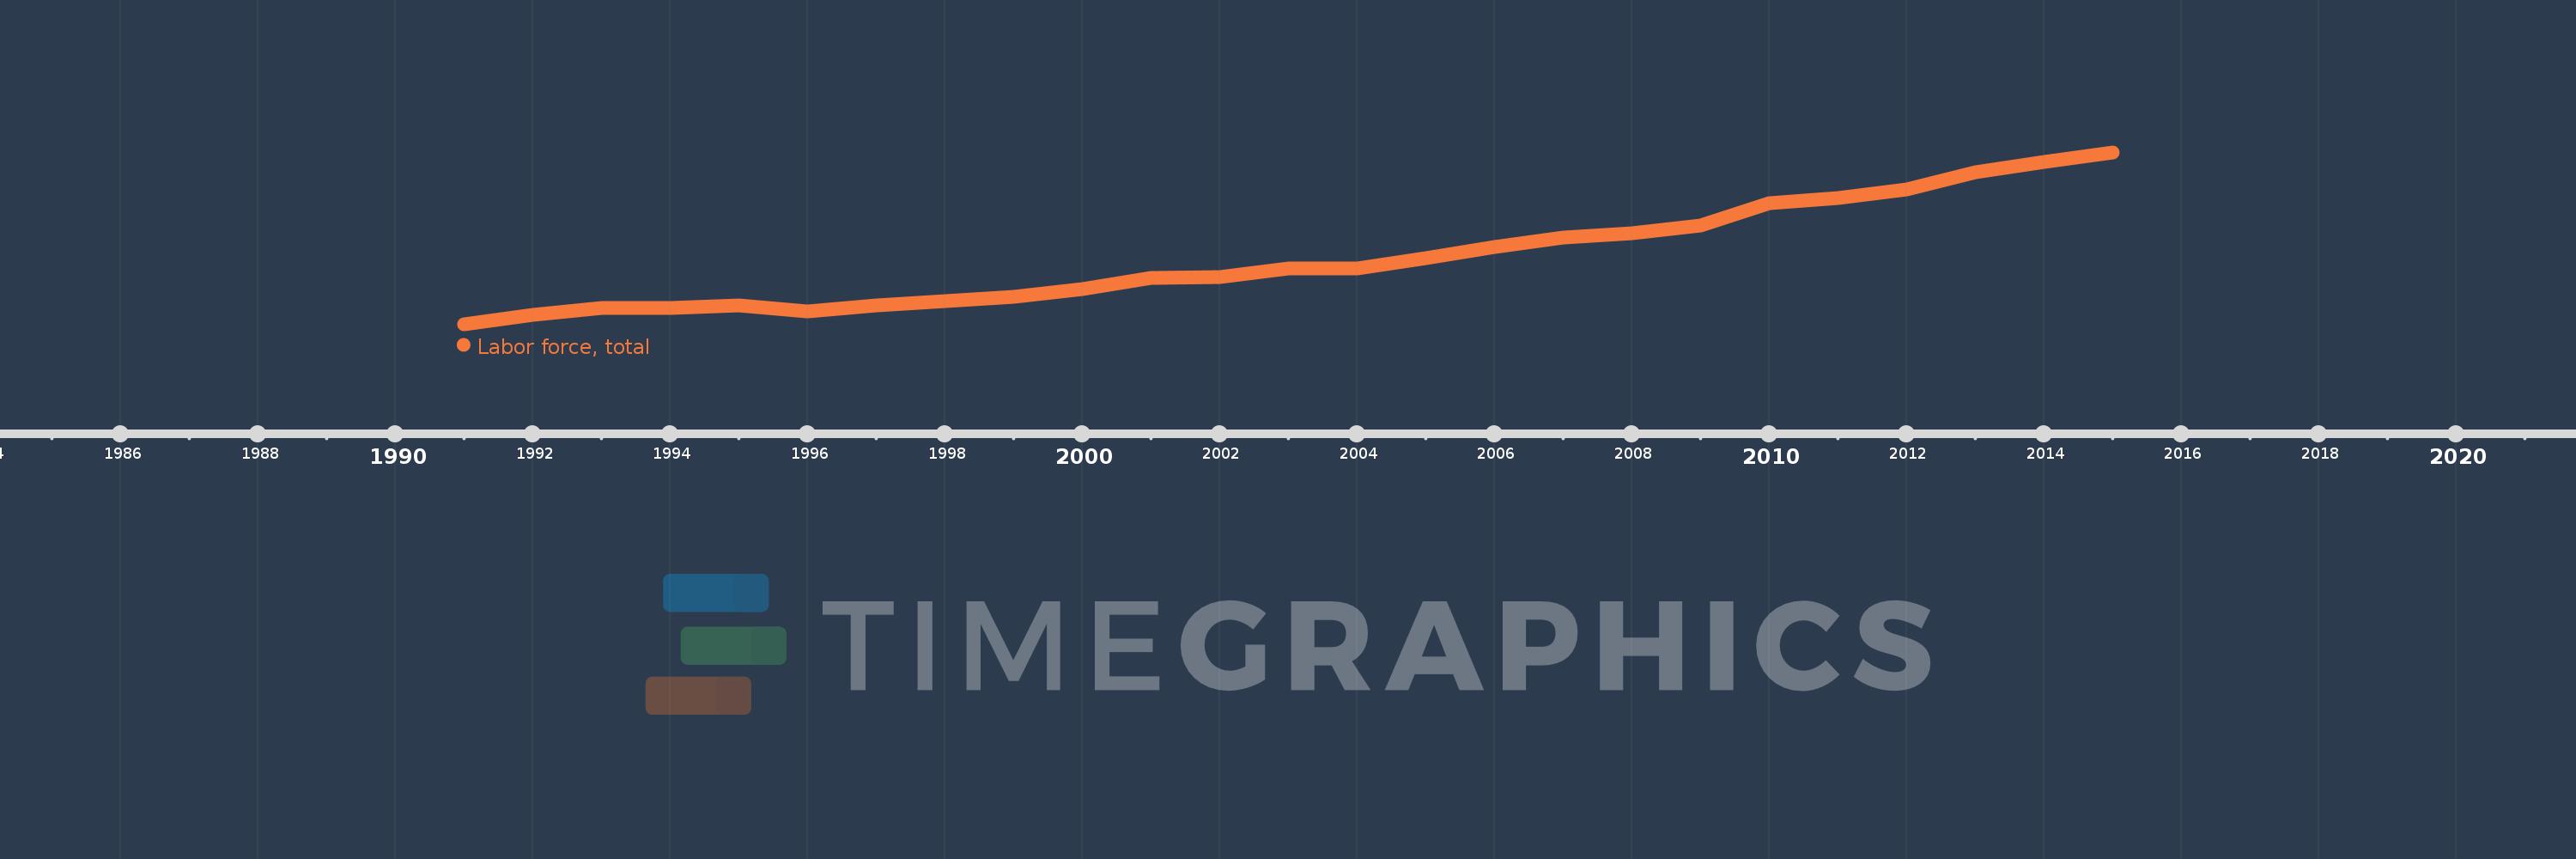
Diese Zeitleiste vorliegt die Graphik ab 1991 J. bis 2015 J. Luxembourg. Die Angaben bis 1990 J. sind nicht vorhanden. Die Zahl aktueller Beobachtungen nach Daten: 25.

Die Quelle (Bezeichnung):

Kennzahlen der Weltentwicklung

Die Quelle (Einrichtung):

International Labour Organization, using World Bank population estimates.

Kategorien:

Education, Social Protection & Labor

Es wurde aktualisiert:

23 Apr 2017 Jahr

Kennzahlen der Wertänderungen vom Jahr zum Jahr

im Durchschnitt:
201.303 Tsnd.
Minimum:
159.998 Tsnd.
1 Jan 1991 Jahr
Maximum:
266.117 Tsnd.
1 Jan 2015 Jahr
Zum Datum der Beobachtung
Wert
Absolute Veränderung
Die Veränderung bezüglich dem vorherigen Wert
1 Jan 1991 Jahr
159.998 Tsnd.
+159.998 Tsnd.
0.0%
1 Jan 1992 Jahr
165.671 Tsnd.
+5.673 Tsnd.
3.55%
1 Jan 1993 Jahr
170.06 Tsnd.
+4.389 Tsnd.
2.65%
1 Jan 1994 Jahr
170.231 Tsnd.
+171.0
0.1%
1 Jan 1995 Jahr
171.712 Tsnd.
+1.481 Tsnd.
0.87%
1 Jan 1996 Jahr
167.651 Tsnd.
-4.061 Tsnd.
-2.37%
1 Jan 1997 Jahr
171.583 Tsnd.
+3.932 Tsnd.
2.35%
1 Jan 1998 Jahr
174.152 Tsnd.
+2.569 Tsnd.
1.5%
1 Jan 1999 Jahr
176.831 Tsnd.
+2.679 Tsnd.
1.54%
1 Jan 2000 Jahr
181.887 Tsnd.
+5.056 Tsnd.
2.86%
1 Jan 2001 Jahr
188.848 Tsnd.
+6.961 Tsnd.
3.83%
1 Jan 2002 Jahr
188.995 Tsnd.
+147.0
0.08%
1 Jan 2003 Jahr
194.689 Tsnd.
+5.694 Tsnd.
3.01%
1 Jan 2004 Jahr
194.66 Tsnd.
-29.0
-0.01%
1 Jan 2005 Jahr
201.029 Tsnd.
+6.369 Tsnd.
3.27%
1 Jan 2006 Jahr
207.436 Tsnd.
+6.407 Tsnd.
3.19%
1 Jan 2007 Jahr
213.63 Tsnd.
+6.194 Tsnd.
2.99%
1 Jan 2008 Jahr
216.346 Tsnd.
+2.716 Tsnd.
1.27%
1 Jan 2009 Jahr
221.198 Tsnd.
+4.852 Tsnd.
2.24%
1 Jan 2010 Jahr
234.836 Tsnd.
+13.638 Tsnd.
6.17%
1 Jan 2011 Jahr
237.978 Tsnd.
+3.142 Tsnd.
1.34%
1 Jan 2012 Jahr
243.183 Tsnd.
+5.205 Tsnd.
2.19%
1 Jan 2013 Jahr
253.795 Tsnd.
+10.612 Tsnd.
4.36%
1 Jan 2014 Jahr
260.057 Tsnd.
+6.262 Tsnd.
2.47%
1 Jan 2015 Jahr
266.117 Tsnd.
+6.06 Tsnd.
2.33%

Bewertung der Länder gemäß mit laufender Statistik nach Jahren