29
/de/
de
AIzaSyAYiBZKx7MnpbEhh9jyipgxe19OcubqV5w
April 1, 2024
208866
New Caledonia
NCL
true
2
1
Net bilateral aid flows from DAC donors, New Zealand (current US$)
2005,2004,2003,2002,2001,2000,1999,1998,1997,1996,1995,1994,1993,1992,1991,1990,1989,1988
Download
Bibliothek der Globalstatistik →New Caledonia →

Net bilateral aid flows from DAC donors, New Zealand (current US$)

Diese Statistik in anderen Ländern:
AfghanistanAlgeriaAngolaAntigua and BarbudaArab WorldArgentinaBahamas, TheBangladeshBarbadosBelizeBeninBhutanBoliviaBosnia and HerzegovinaBotswanaBrazilBrunei DarussalamBurkina FasoBurundiCambodiaCameroonCaribbean small statesCentral African RepublicCentral Europe and the BalticsChadChileChinaColombiaComorosCongo, Dem. Rep.Costa RicaCote d'IvoireCyprusCzech RepublicDjiboutiDominicaEast Asia & PacificEast Asia & Pacific (excluding high income)East Asia & Pacific (IDA & IBRD countries)EcuadorEgypt, Arab Rep.El SalvadorEritreaEthiopiaEuro areaEurope & Central AsiaEurope & Central Asia (excluding high income)Europe & Central Asia (IDA & IBRD countries)European UnionFijiFragile and conflict affected situationsFrench PolynesiaGambia, TheGhanaGrenadaGuatemalaGuinea-BissauGuyanaHaitiHeavily indebted poor countries (HIPC)High incomeHondurasHong Kong SAR, ChinaHungaryIBRD onlyIDA & IBRD totalIDA blendIDA onlyIDA totalIndiaIndonesiaIran, Islamic Rep.IraqIsraelJamaicaJordanKazakhstanKenyaKiribatiKorea, Dem. People’s Rep.Korea, Rep.KuwaitKyrgyz RepublicLao PDRLatin America & Caribbean Latin America & Caribbean (excluding high income)Latin America & the Caribbean (IDA & IBRD countries)Least developed countries: UN classificationLebanonLesothoLiberiaLibyaLow & middle incomeLow incomeLower middle incomeMadagascarMalawiMalaysiaMaldivesMaliMaltaMarshall IslandsMauritaniaMauritiusMexicoMicronesia, Fed. Sts.Middle East & North AfricaMiddle East & North Africa (excluding high income)Middle East & North Africa (IDA & IBRD countries)Middle incomeMongoliaMoroccoMozambiqueMyanmarNamibiaNauruNepalNew CaledoniaNicaraguaNigerNigeriaNorthern Mariana IslandsOECD membersOther small statesPacific island small statesPakistanPalauPapua New GuineaParaguayPeruPhilippinesRussian FederationRwandaSamoaSenegalSerbiaSeychellesSierra LeoneSingaporeSlovak RepublicSmall statesSolomon IslandsSomaliaSouth AfricaSouth AsiaSouth Asia (IDA & IBRD)South SudanSri LankaSt. LuciaSt. Vincent and the GrenadinesSub-Saharan Africa Sub-Saharan Africa (excluding high income)Sub-Saharan Africa (IDA & IBRD countries)SudanSurinameSwazilandSyrian Arab RepublicTajikistanTanzaniaThailandTimor-LesteTongaTrinidad and TobagoTunisiaTurkeyTurkmenistanTuvaluUgandaUpper middle incomeUruguayUzbekistanVanuatuVenezuela, RBVietnamWest Bank and GazaWorldYemen, Rep.ZambiaZimbabwe
Zeitlinie:
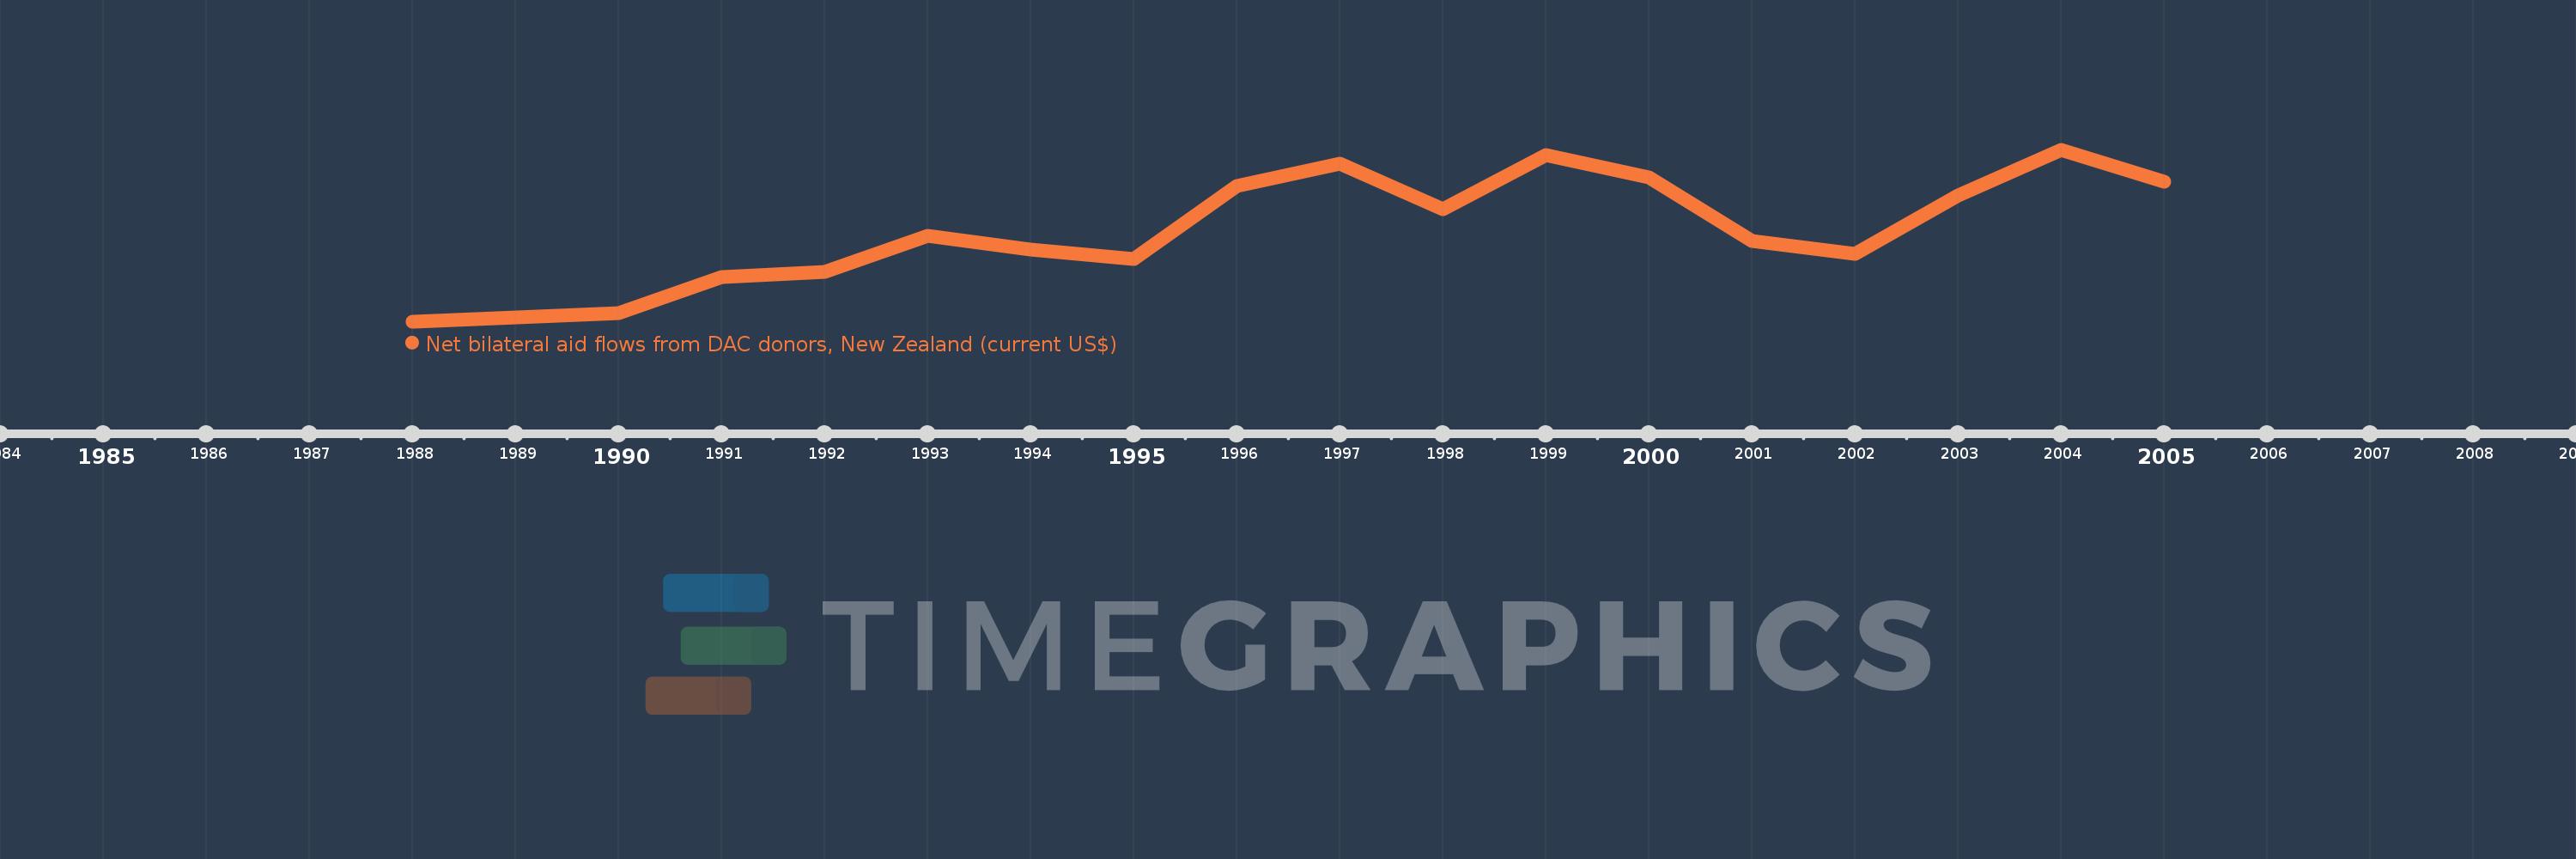
Diese Zeitleiste vorliegt die Graphik ab 1988 J. bis 2005 J. New Caledonia. Die Angaben bis 1987 J. sind nicht vorhanden. Die Zahl aktueller Beobachtungen nach Daten: 18.
Die Quelle (Bezeichnung):
Kennzahlen der Weltentwicklung
Die Quelle (Einrichtung):
Development Assistance Committee of the Organisation for Economic Co-operation and Development, Geographical Distribution of Financial Flows to Developing Countries, Development Co-operation Report, and International Development Statistics database. Data are available online at: www.oecd.org/dac/stats/idsonline.
Kategorien:
Aid Effectiveness
Es wurde aktualisiert:
23 Apr 2017 Jahr
Kennzahlen der Wertänderungen vom Jahr zum Jahr
im Durchschnitt:
211.111 Tsnd.
Minimum:
10.0 Tsnd.
1 Jan 1988 Jahr
Maximum:
390.0 Tsnd.
1 Jan 2004 Jahr
Zum Datum der Beobachtung
Wert
Absolute Veränderung
Die Veränderung bezüglich dem vorherigen Wert
1 Jan 1988 Jahr
10.0 Tsnd.
+10.0 Tsnd.
0.0%
1 Jan 1989 Jahr
20.0 Tsnd.
+10.0 Tsnd.
100.0%
1 Jan 1990 Jahr
30.0 Tsnd.
+10.0 Tsnd.
50.0%
1 Jan 1991 Jahr
110.0 Tsnd.
+80.0 Tsnd.
266.67%
1 Jan 1992 Jahr
120.0 Tsnd.
+10.0 Tsnd.
9.09%
1 Jan 1993 Jahr
200.0 Tsnd.
+80.0 Tsnd.
66.67%
1 Jan 1994 Jahr
170.0 Tsnd.
-30.0 Tsnd.
-15.0%
1 Jan 1995 Jahr
150.0 Tsnd.
-20.0 Tsnd.
-11.76%
1 Jan 1996 Jahr
310.0 Tsnd.
+160.0 Tsnd.
106.67%
1 Jan 1997 Jahr
360.0 Tsnd.
+50.0 Tsnd.
16.13%
1 Jan 1998 Jahr
260.0 Tsnd.
-100.0 Tsnd.
-27.78%
1 Jan 1999 Jahr
380.0 Tsnd.
+120.0 Tsnd.
46.15%
1 Jan 2000 Jahr
330.0 Tsnd.
-50.0 Tsnd.
-13.16%
1 Jan 2001 Jahr
190.0 Tsnd.
-140.0 Tsnd.
-42.42%
1 Jan 2002 Jahr
160.0 Tsnd.
-30.0 Tsnd.
-15.79%
1 Jan 2003 Jahr
290.0 Tsnd.
+130.0 Tsnd.
81.25%
1 Jan 2004 Jahr
390.0 Tsnd.
+100.0 Tsnd.
34.48%
1 Jan 2005 Jahr
320.0 Tsnd.
-70.0 Tsnd.
-17.95%
Bewertung der Länder gemäß mit laufender Statistik nach Jahren

Kommentare:

Abschicken
PremiumAbout & FeedbackVereinbarungPrivatheit
logo
© 2022 Selected Technologies LLC – Morgan Hill, California