33
/de/
AIzaSyAYiBZKx7MnpbEhh9jyipgxe19OcubqV5w
August 1, 2025
176737
Lebanon
LBN
true
2
1
Net bilateral aid flows from DAC donors, New Zealand (current US$)
2013,2012,2011,2010,2009,2007,1998,1997,1996,1995,1987,1986,1985
Download
Bibliothek der Globalstatistik →Lebanon →

Net bilateral aid flows from DAC donors, New Zealand (current US$)

Diese Statistik in anderen Ländern:

AfghanistanAlgeriaAngolaAntigua and BarbudaArab WorldArgentinaBahamas, TheBangladeshBarbadosBelizeBeninBhutanBoliviaBosnia and HerzegovinaBotswanaBrazilBrunei DarussalamBurkina FasoBurundiCambodiaCameroonCaribbean small statesCentral African RepublicCentral Europe and the BalticsChadChileChinaColombiaComorosCongo, Dem. Rep.Costa RicaCote d'IvoireCyprusCzech RepublicDjiboutiDominicaEast Asia & PacificEast Asia & Pacific (excluding high income)East Asia & Pacific (IDA & IBRD countries)EcuadorEgypt, Arab Rep.El SalvadorEritreaEthiopiaEuro areaEurope & Central AsiaEurope & Central Asia (excluding high income)Europe & Central Asia (IDA & IBRD countries)European UnionFijiFragile and conflict affected situationsFrench PolynesiaGambia, TheGhanaGrenadaGuatemalaGuinea-BissauGuyanaHaitiHeavily indebted poor countries (HIPC)High incomeHondurasHong Kong SAR, ChinaHungaryIBRD onlyIDA & IBRD totalIDA blendIDA onlyIDA totalIndiaIndonesiaIran, Islamic Rep.IraqIsraelJamaicaJordanKazakhstanKenyaKiribatiKorea, Dem. People’s Rep.Korea, Rep.KuwaitKyrgyz RepublicLao PDRLatin America & Caribbean Latin America & Caribbean (excluding high income)Latin America & the Caribbean (IDA & IBRD countries)Least developed countries: UN classificationLebanonLesothoLiberiaLibyaLow & middle incomeLow incomeLower middle incomeMadagascarMalawiMalaysiaMaldivesMaliMaltaMarshall IslandsMauritaniaMauritiusMexicoMicronesia, Fed. Sts.Middle East & North AfricaMiddle East & North Africa (excluding high income)Middle East & North Africa (IDA & IBRD countries)Middle incomeMongoliaMoroccoMozambiqueMyanmarNamibiaNauruNepalNew CaledoniaNicaraguaNigerNigeriaNorthern Mariana IslandsOECD membersOther small statesPacific island small statesPakistanPalauPapua New GuineaParaguayPeruPhilippinesRussian FederationRwandaSamoaSenegalSerbiaSeychellesSierra LeoneSingaporeSlovak RepublicSmall statesSolomon IslandsSomaliaSouth AfricaSouth AsiaSouth Asia (IDA & IBRD)South SudanSri LankaSt. LuciaSt. Vincent and the GrenadinesSub-Saharan Africa Sub-Saharan Africa (excluding high income)Sub-Saharan Africa (IDA & IBRD countries)SudanSurinameSwazilandSyrian Arab RepublicTajikistanTanzaniaThailandTimor-LesteTongaTrinidad and TobagoTunisiaTurkeyTurkmenistanTuvaluUgandaUpper middle incomeUruguayUzbekistanVanuatuVenezuela, RBVietnamWest Bank and GazaWorldYemen, Rep.ZambiaZimbabwe

Zeitlinie:

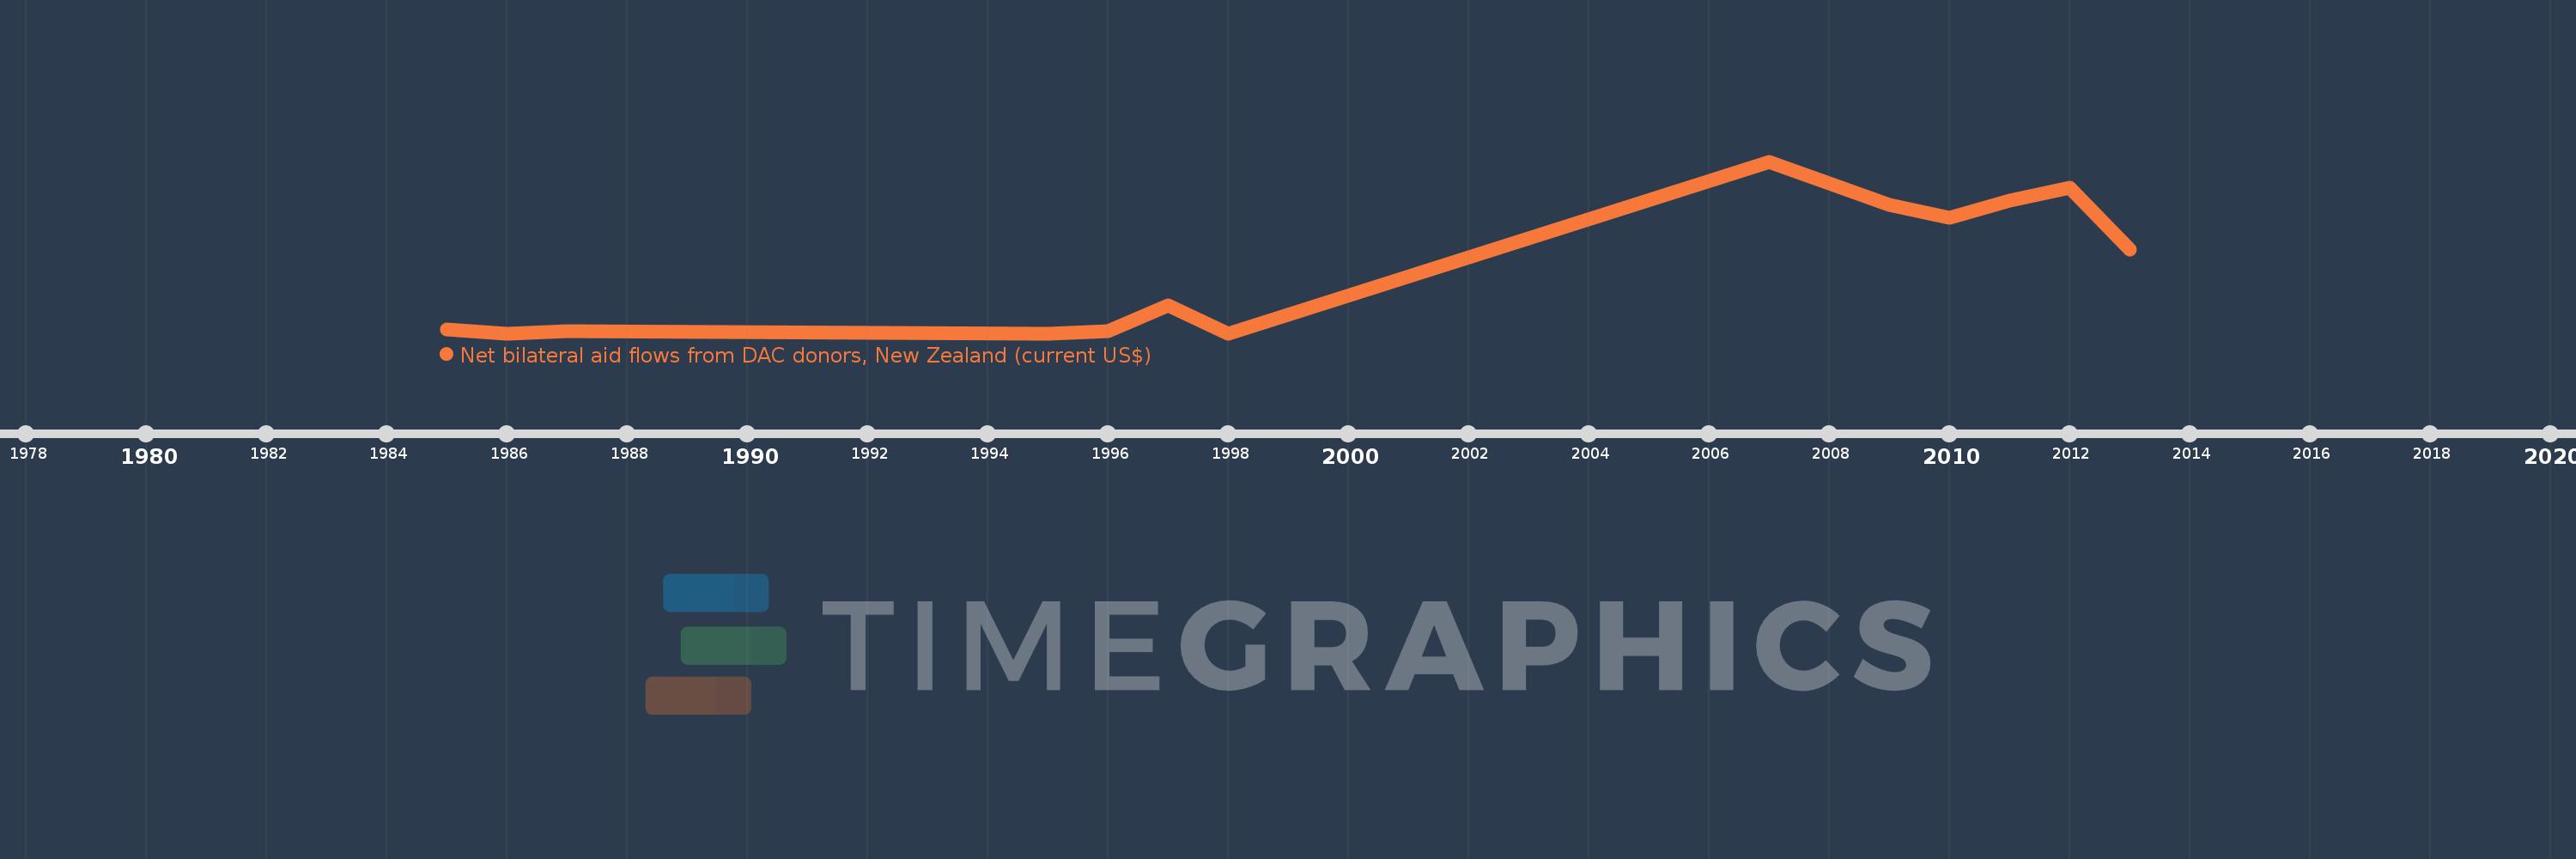
Diese Zeitleiste vorliegt die Graphik ab 1985 J. bis 2013 J. Lebanon. Die Angaben bis 1984 J. sind nicht vorhanden. Die Zahl aktueller Beobachtungen nach Daten: 13.

Die Quelle (Bezeichnung):

Kennzahlen der Weltentwicklung

Die Quelle (Einrichtung):

Development Assistance Committee of the Organisation for Economic Co-operation and Development, Geographical Distribution of Financial Flows to Developing Countries, Development Co-operation Report, and International Development Statistics database. Data are available online at: www.oecd.org/dac/stats/idsonline.

Kategorien:

Aid Effectiveness

Es wurde aktualisiert:

23 Apr 2017 Jahr

Kennzahlen der Wertänderungen vom Jahr zum Jahr

im Durchschnitt:
302.308 Tsnd.
Minimum:
10.0 Tsnd.
1 Jan 1986 Jahr
Maximum:
810.0 Tsnd.
1 Jan 2007 Jahr
Zum Datum der Beobachtung
Wert
Absolute Veränderung
Die Veränderung bezüglich dem vorherigen Wert
1 Jan 1985 Jahr
30.0 Tsnd.
+30.0 Tsnd.
0.0%
1 Jan 1986 Jahr
10.0 Tsnd.
-20.0 Tsnd.
-66.67%
1 Jan 1987 Jahr
20.0 Tsnd.
+10.0 Tsnd.
100.0%
1 Jan 1995 Jahr
10.0 Tsnd.
-10.0 Tsnd.
-50.0%
1 Jan 1996 Jahr
20.0 Tsnd.
+10.0 Tsnd.
100.0%
1 Jan 1997 Jahr
140.0 Tsnd.
+120.0 Tsnd.
600.0%
1 Jan 1998 Jahr
10.0 Tsnd.
-130.0 Tsnd.
-92.86%
1 Jan 2007 Jahr
810.0 Tsnd.
+800.0 Tsnd.
8.0 Tsnd.%
1 Jan 2009 Jahr
610.0 Tsnd.
-200.0 Tsnd.
-24.69%
1 Jan 2010 Jahr
550.0 Tsnd.
-60.0 Tsnd.
-9.84%
1 Jan 2011 Jahr
630.0 Tsnd.
+80.0 Tsnd.
14.55%
1 Jan 2012 Jahr
690.0 Tsnd.
+60.0 Tsnd.
9.52%
1 Jan 2013 Jahr
400.0 Tsnd.
-290.0 Tsnd.
-42.03%

Bewertung der Länder gemäß mit laufender Statistik nach Jahren