29
/de/
de
AIzaSyAYiBZKx7MnpbEhh9jyipgxe19OcubqV5w
April 1, 2024
173198
Kyrgyz Republic
KGZ
true
2
1
Net bilateral aid flows from DAC donors, Sweden (current US$)
2015,2014,2013,2012,2011,2010,2009,2008,2007,2006,2005,2004,2003,2002,2001,2000,1999,1996,1993
Download
Bibliothek der Globalstatistik →Kyrgyz Republic →

Net bilateral aid flows from DAC donors, Sweden (current US$)

Diese Statistik in anderen Ländern:
AfghanistanAlbaniaAlgeriaAngolaAntigua and BarbudaArab WorldArgentinaArmeniaAzerbaijanBangladeshBelarusBelizeBeninBhutanBoliviaBosnia and HerzegovinaBotswanaBrazilBrunei DarussalamBulgariaBurkina FasoBurundiCabo VerdeCambodiaCameroonCaribbean small statesCentral African RepublicCentral Europe and the BalticsChadChileChinaColombiaComorosCongo, Dem. Rep.Congo, Rep.Costa RicaCote d'IvoireCroatiaCubaCyprusCzech RepublicDjiboutiDominicaDominican RepublicEast Asia & PacificEast Asia & Pacific (excluding high income)East Asia & Pacific (IDA & IBRD countries)EcuadorEgypt, Arab Rep.El SalvadorEquatorial GuineaEritreaEstoniaEthiopiaEuro areaEurope & Central AsiaEurope & Central Asia (excluding high income)Europe & Central Asia (IDA & IBRD countries)European UnionFijiFragile and conflict affected situationsGabonGambia, TheGeorgiaGhanaGrenadaGuatemalaGuineaGuinea-BissauGuyanaHaitiHeavily indebted poor countries (HIPC)High incomeHondurasHong Kong SAR, ChinaHungaryIBRD onlyIDA & IBRD totalIDA blendIDA onlyIDA totalIndiaIndonesiaIran, Islamic Rep.IraqIsraelJamaicaJordanKazakhstanKenyaKorea, Dem. People’s Rep.Korea, Rep.KosovoKuwaitKyrgyz RepublicLao PDRLatin America & Caribbean Latin America & Caribbean (excluding high income)Latin America & the Caribbean (IDA & IBRD countries)LatviaLeast developed countries: UN classificationLebanonLesothoLiberiaLibyaLithuaniaLow & middle incomeLow incomeLower middle incomeMacao SAR, ChinaMacedonia, FYRMadagascarMalawiMalaysiaMaldivesMaliMarshall IslandsMauritaniaMauritiusMexicoMicronesia, Fed. Sts.Middle East & North AfricaMiddle East & North Africa (excluding high income)Middle East & North Africa (IDA & IBRD countries)Middle incomeMoldovaMongoliaMontenegroMoroccoMozambiqueMyanmarNamibiaNepalNicaraguaNigerNigeriaOECD membersOther small statesPacific island small statesPakistanPanamaPapua New GuineaParaguayPeruPhilippinesPolandRomaniaRussian FederationRwandaSamoaSao Tome and PrincipeSaudi ArabiaSenegalSerbiaSeychellesSierra LeoneSingaporeSlovak RepublicSloveniaSmall statesSolomon IslandsSomaliaSouth AfricaSouth AsiaSouth Asia (IDA & IBRD)South SudanSri LankaSt. Kitts and NevisSt. LuciaSt. Vincent and the GrenadinesSub-Saharan Africa Sub-Saharan Africa (excluding high income)Sub-Saharan Africa (IDA & IBRD countries)SudanSurinameSwazilandSyrian Arab RepublicTajikistanTanzaniaThailandTimor-LesteTogoTrinidad and TobagoTunisiaTurkeyTurkmenistanUgandaUkraineUpper middle incomeUruguayUzbekistanVanuatuVenezuela, RBVietnamWest Bank and GazaWorldYemen, Rep.ZambiaZimbabwe
Zeitlinie:
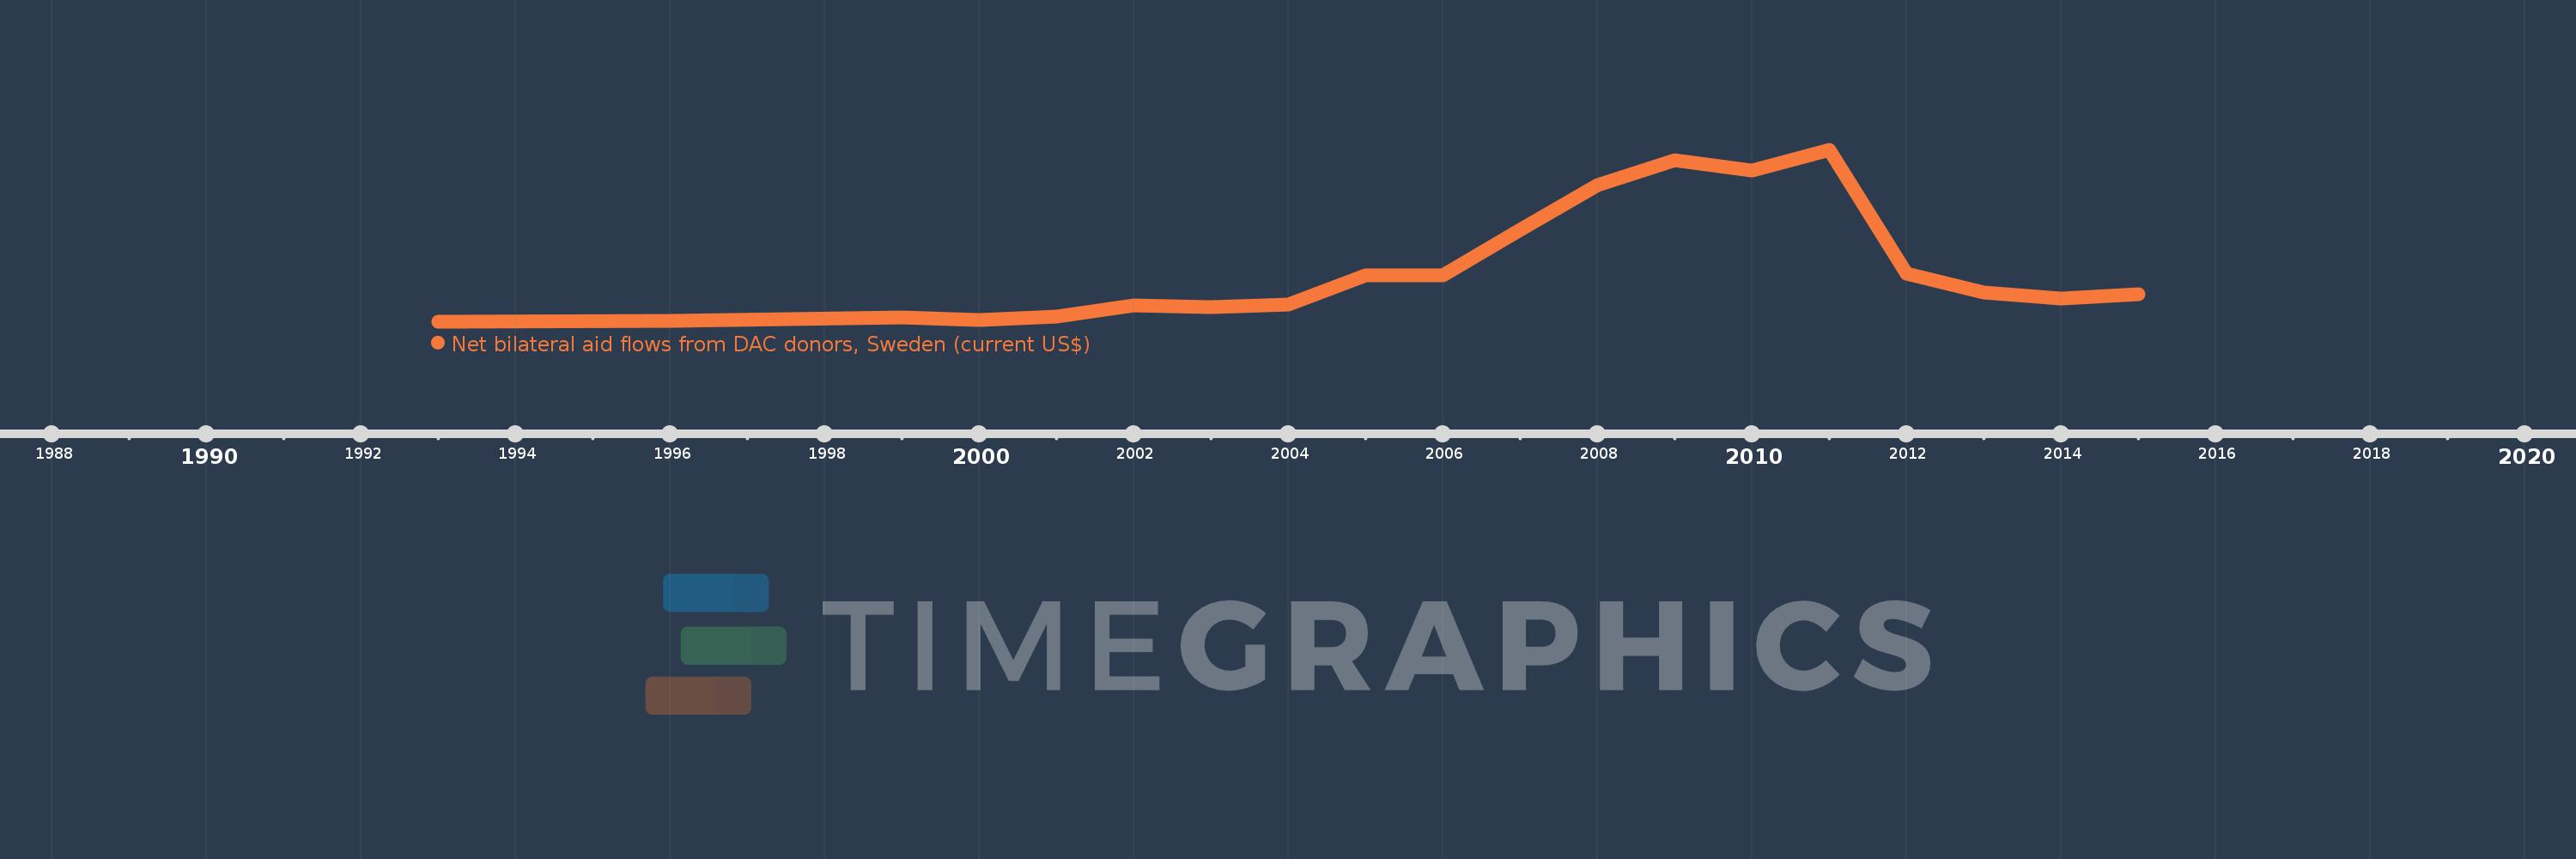
Diese Zeitleiste vorliegt die Graphik ab 1993 J. bis 2015 J. Kyrgyz Republic. Die Angaben bis 1992 J. sind nicht vorhanden. Die Zahl aktueller Beobachtungen nach Daten: 19.
Die Quelle (Bezeichnung):
Kennzahlen der Weltentwicklung
Die Quelle (Einrichtung):
Development Assistance Committee of the Organisation for Economic Co-operation and Development, Geographical Distribution of Financial Flows to Developing Countries, Development Co-operation Report, and International Development Statistics database. Data are available online at: www.oecd.org/dac/stats/idsonline.
Kategorien:
Aid Effectiveness
Es wurde aktualisiert:
23 Apr 2017 Jahr
Kennzahlen der Wertänderungen vom Jahr zum Jahr
im Durchschnitt:
2.849 Mln.
Minimum:
20.0 Tsnd.
1 Jan 1993 Jahr
Maximum:
9.27 Mln.
1 Jan 2011 Jahr
Zum Datum der Beobachtung
Wert
Absolute Veränderung
Die Veränderung bezüglich dem vorherigen Wert
1 Jan 1993 Jahr
20.0 Tsnd.
+20.0 Tsnd.
0.0%
1 Jan 1996 Jahr
70.0 Tsnd.
+50.0 Tsnd.
250.0%
1 Jan 1999 Jahr
250.0 Tsnd.
+180.0 Tsnd.
257.14%
1 Jan 2000 Jahr
120.0 Tsnd.
-130.0 Tsnd.
-52.0%
1 Jan 2001 Jahr
290.0 Tsnd.
+170.0 Tsnd.
141.67%
1 Jan 2002 Jahr
900.0 Tsnd.
+610.0 Tsnd.
210.34%
1 Jan 2003 Jahr
840.0 Tsnd.
-60.0 Tsnd.
-6.67%
1 Jan 2004 Jahr
970.0 Tsnd.
+130.0 Tsnd.
15.48%
1 Jan 2005 Jahr
2.53 Mln.
+1.56 Mln.
160.82%
1 Jan 2006 Jahr
2.52 Mln.
-10.0 Tsnd.
-0.4%
1 Jan 2007 Jahr
4.98 Mln.
+2.46 Mln.
97.62%
1 Jan 2008 Jahr
7.39 Mln.
+2.41 Mln.
48.39%
1 Jan 2009 Jahr
8.74 Mln.
+1.35 Mln.
18.27%
1 Jan 2010 Jahr
8.19 Mln.
-550.0 Tsnd.
-6.29%
1 Jan 2011 Jahr
9.27 Mln.
+1.08 Mln.
13.19%
1 Jan 2012 Jahr
2.62 Mln.
-6.65 Mln.
-71.74%
1 Jan 2013 Jahr
1.62 Mln.
-1000.0 Tsnd.
-38.17%
1 Jan 2014 Jahr
1.29 Mln.
-330.0 Tsnd.
-20.37%
1 Jan 2015 Jahr
1.52 Mln.
+230.0 Tsnd.
17.83%
Bewertung der Länder gemäß mit laufender Statistik nach Jahren

Kommentare:

Abschicken
PremiumAbout & FeedbackVereinbarungPrivatheit
logo
© 2022 Selected Technologies LLC – Morgan Hill, California