33
/de/
AIzaSyB4mHJ5NPEv-XzF7P6NDYXjlkCWaeKw5bc
November 1, 2025
170261
Korea, Rep.
KOR
true
2
1
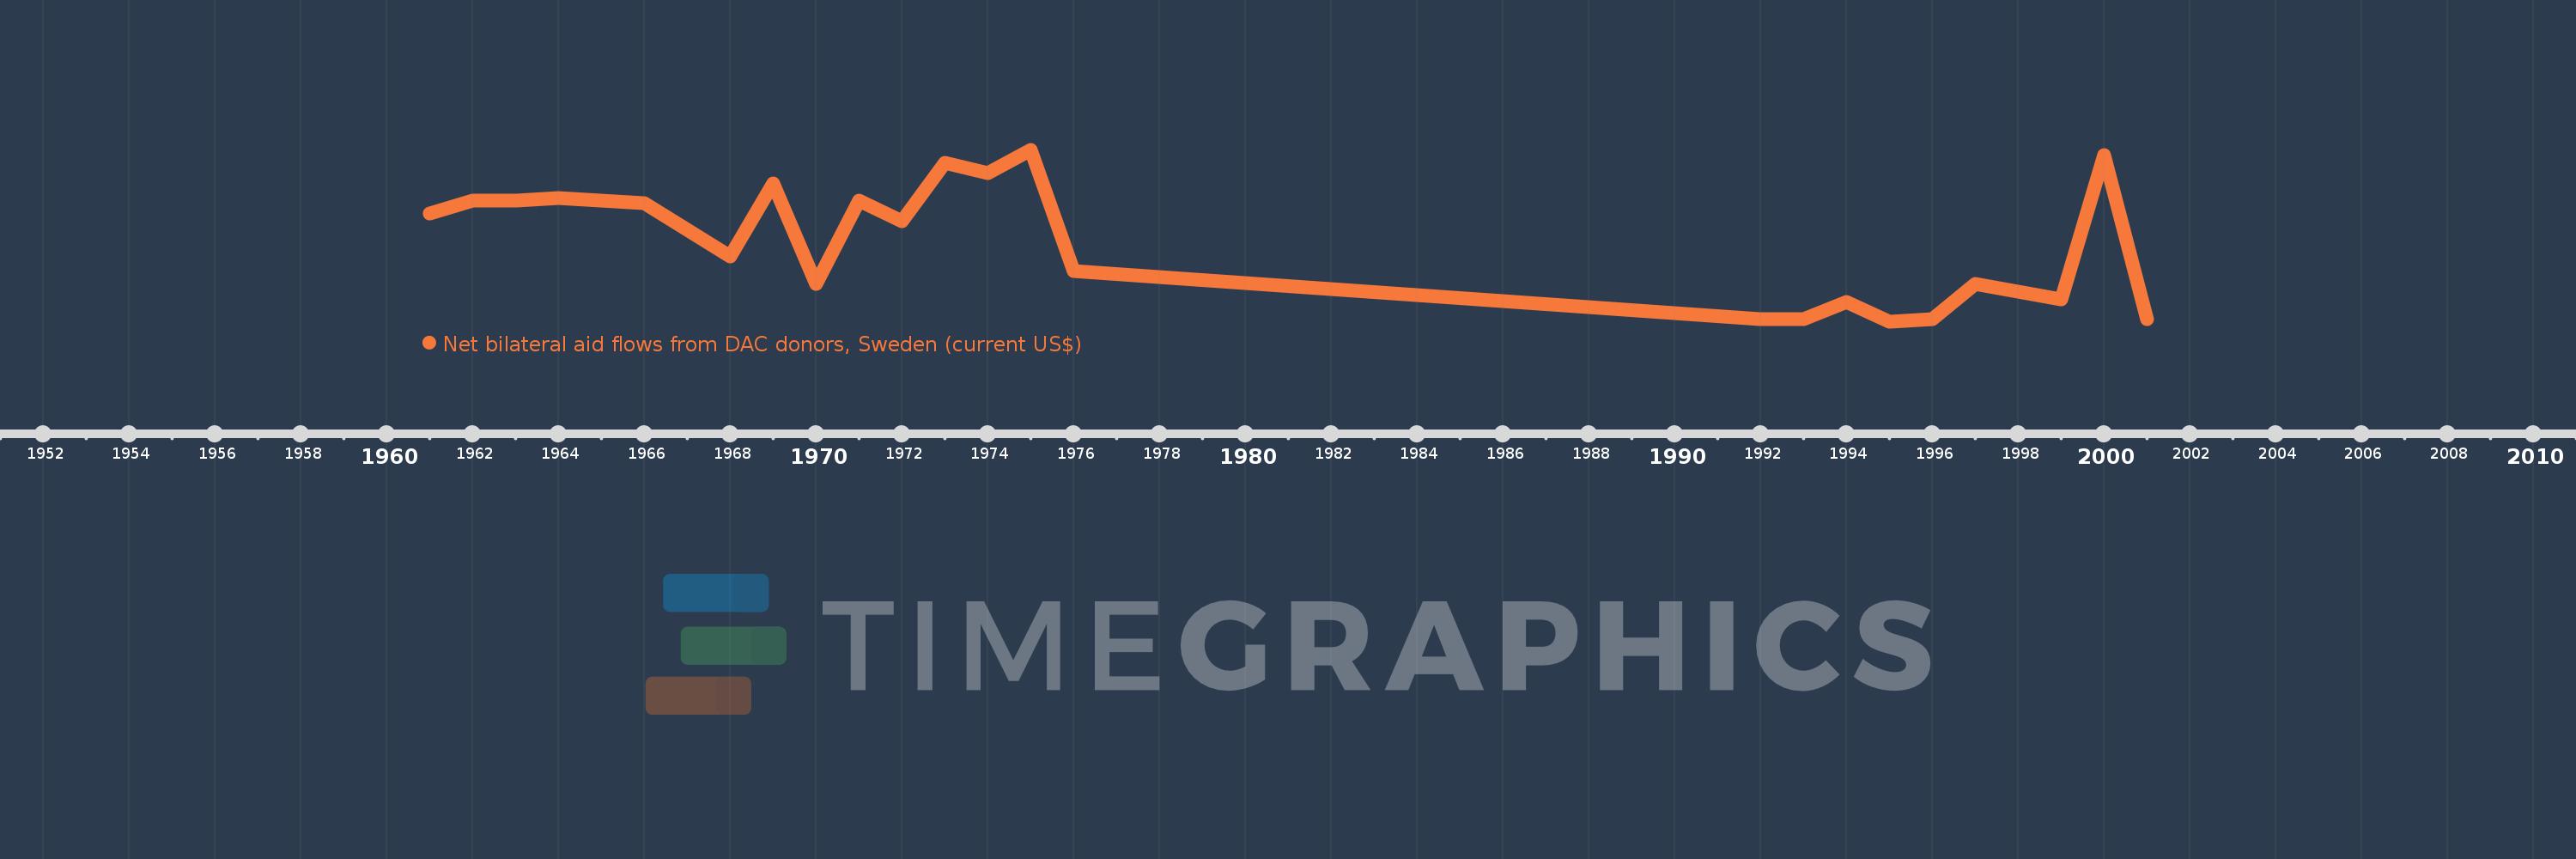
Net bilateral aid flows from DAC donors, Sweden (current US$)
2001,2000,1999,1997,1996,1995,1994,1993,1992,1976,1975,1974,1973,1972,1971,1970,1969,1968,1966,1964,1963,1962,1961