33
/de/
AIzaSyAYiBZKx7MnpbEhh9jyipgxe19OcubqV5w
August 1, 2025
170301
Korea, Rep.
KOR
true
2
1
Net official flows from UN agencies, UNFPA (current US$)
1999,1997,1995,1994,1993,1992,1991,1990,1989,1988,1987,1986,1985,1984,1983,1982,1981,1978
Download
Bibliothek der Globalstatistik →Korea, Rep. →

Net official flows from UN agencies, UNFPA (current US$)

Diese Statistik in anderen Ländern:

AfghanistanAlbaniaAlgeriaAngolaAntigua and BarbudaArab WorldArgentinaArmeniaAzerbaijanBahamas, TheBahrainBangladeshBarbadosBelarusBelizeBeninBermudaBhutanBoliviaBosnia and HerzegovinaBotswanaBrazilBritish Virgin IslandsBulgariaBurkina FasoBurundiCabo VerdeCambodiaCameroonCaribbean small statesCayman IslandsCentral African RepublicCentral Europe and the BalticsChadChileChinaColombiaComorosCongo, Dem. Rep.Congo, Rep.Costa RicaCote d'IvoireCroatiaCubaCyprusDjiboutiDominicaDominican RepublicEast Asia & PacificEast Asia & Pacific (excluding high income)East Asia & Pacific (IDA & IBRD countries)EcuadorEgypt, Arab Rep.El SalvadorEquatorial GuineaEritreaEstoniaEthiopiaEuro areaEurope & Central AsiaEurope & Central Asia (excluding high income)Europe & Central Asia (IDA & IBRD countries)European UnionFijiFragile and conflict affected situationsGabonGambia, TheGeorgiaGhanaGrenadaGuatemalaGuineaGuinea-BissauGuyanaHaitiHeavily indebted poor countries (HIPC)High incomeHondurasHong Kong SAR, ChinaHungaryIBRD onlyIDA & IBRD totalIDA blendIDA onlyIDA totalIndiaIndonesiaIran, Islamic Rep.IraqJamaicaJordanKazakhstanKenyaKiribatiKorea, Dem. People’s Rep.Korea, Rep.KosovoKuwaitKyrgyz RepublicLao PDRLatin America & Caribbean Latin America & Caribbean (excluding high income)Latin America & the Caribbean (IDA & IBRD countries)LatviaLeast developed countries: UN classificationLebanonLesothoLiberiaLibyaLithuaniaLow & middle incomeLow incomeLower middle incomeMacedonia, FYRMadagascarMalawiMalaysiaMaldivesMaliMaltaMarshall IslandsMauritaniaMauritiusMexicoMicronesia, Fed. Sts.Middle East & North AfricaMiddle East & North Africa (excluding high income)Middle East & North Africa (IDA & IBRD countries)Middle incomeMoldovaMongoliaMontenegroMoroccoMozambiqueMyanmarNamibiaNepalNicaraguaNigerNigeriaNorth AmericaNorthern Mariana IslandsOECD membersOmanOther small statesPacific island small statesPakistanPalauPanamaPapua New GuineaParaguayPeruPhilippinesPolandQatarRomaniaRussian FederationRwandaSamoaSao Tome and PrincipeSaudi ArabiaSenegalSerbiaSeychellesSierra LeoneSingaporeSmall statesSolomon IslandsSomaliaSouth AfricaSouth AsiaSouth Asia (IDA & IBRD)South SudanSri LankaSt. Kitts and NevisSt. LuciaSt. Vincent and the GrenadinesSub-Saharan Africa Sub-Saharan Africa (excluding high income)Sub-Saharan Africa (IDA & IBRD countries)SudanSurinameSwazilandSyrian Arab RepublicTajikistanTanzaniaThailandTimor-LesteTogoTongaTrinidad and TobagoTunisiaTurkeyTurkmenistanTurks and Caicos IslandsTuvaluUgandaUkraineUnited Arab EmiratesUpper middle incomeUruguayUzbekistanVanuatuVenezuela, RBVietnamWest Bank and GazaWorldYemen, Rep.ZambiaZimbabwe

Zeitlinie:

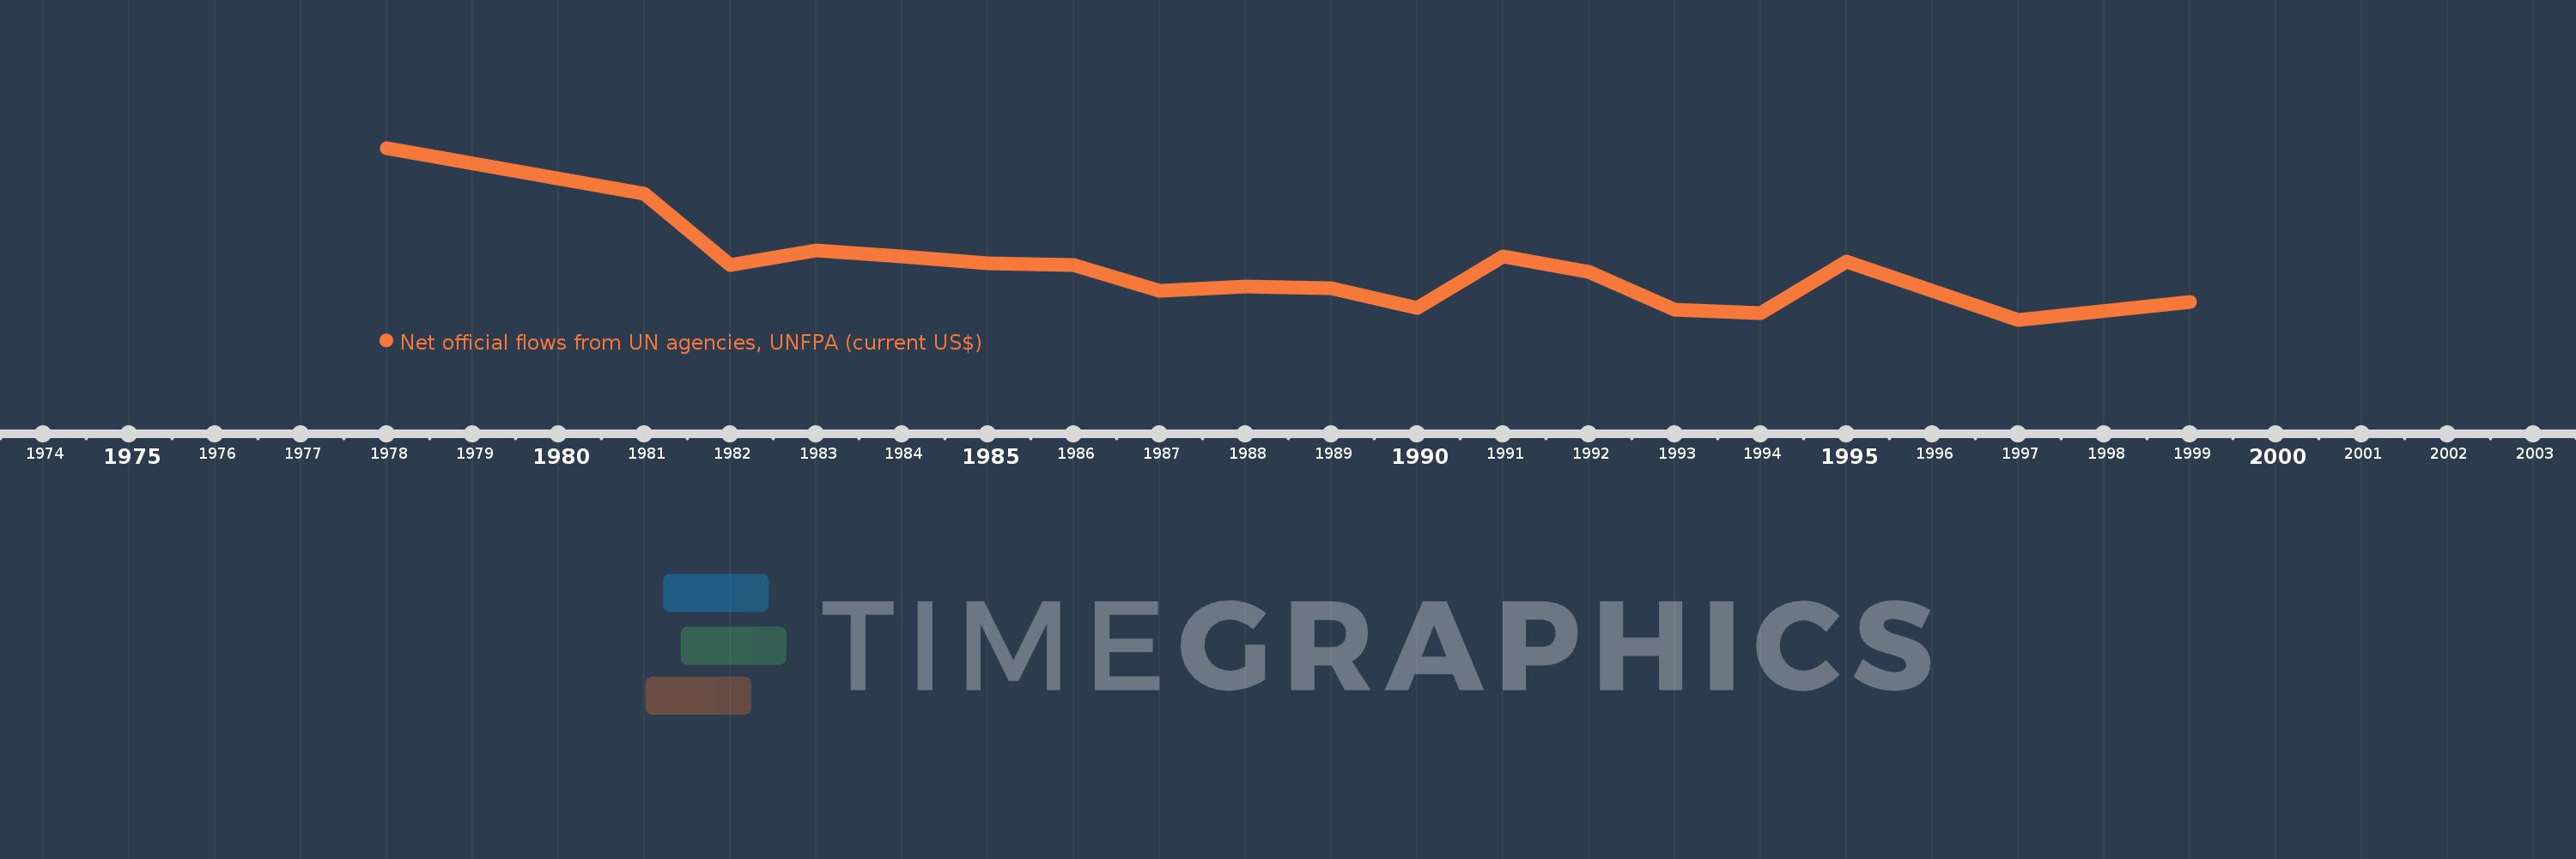
Diese Zeitleiste vorliegt die Graphik ab 1978 J. bis 1999 J. Korea, Rep.. Die Angaben bis 1977 J. sind nicht vorhanden. Die Zahl aktueller Beobachtungen nach Daten: 18.

Die Quelle (Bezeichnung):

Kennzahlen der Weltentwicklung

Die Quelle (Einrichtung):

Development Assistance Committee of the Organisation for Economic Co-operation and Development, Geographical Distribution of Financial Flows to Developing Countries, Development Co-operation Report, and International Development Statistics database. Data are available online at: www.oecd.org/dac/stats/idsonline.

Kategorien:

Aid Effectiveness

Es wurde aktualisiert:

23 Apr 2017 Jahr

Kennzahlen der Wertänderungen vom Jahr zum Jahr

im Durchschnitt:
407.778 Tsnd.
Minimum:
10.0 Tsnd.
1 Jan 1997 Jahr
Maximum:
1.37 Mln.
1 Jan 1978 Jahr
Zum Datum der Beobachtung
Wert
Absolute Veränderung
Die Veränderung bezüglich dem vorherigen Wert
1 Jan 1978 Jahr
1.37 Mln.
+1.37 Mln.
0.0%
1 Jan 1981 Jahr
1.01 Mln.
-360.0 Tsnd.
-26.28%
1 Jan 1982 Jahr
440.0 Tsnd.
-570.0 Tsnd.
-56.44%
1 Jan 1983 Jahr
560.0 Tsnd.
+120.0 Tsnd.
27.27%
1 Jan 1984 Jahr
510.0 Tsnd.
-50.0 Tsnd.
-8.93%
1 Jan 1985 Jahr
460.0 Tsnd.
-50.0 Tsnd.
-9.8%
1 Jan 1986 Jahr
440.0 Tsnd.
-20.0 Tsnd.
-4.35%
1 Jan 1987 Jahr
240.0 Tsnd.
-200.0 Tsnd.
-45.45%
1 Jan 1988 Jahr
270.0 Tsnd.
+30.0 Tsnd.
12.5%
1 Jan 1989 Jahr
260.0 Tsnd.
-10.0 Tsnd.
-3.7%
1 Jan 1990 Jahr
100.0 Tsnd.
-160.0 Tsnd.
-61.54%
1 Jan 1991 Jahr
510.0 Tsnd.
+410.0 Tsnd.
410.0%
1 Jan 1992 Jahr
390.0 Tsnd.
-120.0 Tsnd.
-23.53%
1 Jan 1993 Jahr
90.0 Tsnd.
-300.0 Tsnd.
-76.92%
1 Jan 1994 Jahr
60.0 Tsnd.
-30.0 Tsnd.
-33.33%
1 Jan 1995 Jahr
470.0 Tsnd.
+410.0 Tsnd.
683.33%
1 Jan 1997 Jahr
10.0 Tsnd.
-460.0 Tsnd.
-97.87%
1 Jan 1999 Jahr
150.0 Tsnd.
+140.0 Tsnd.
1.4 Tsnd.%

Bewertung der Länder gemäß mit laufender Statistik nach Jahren