33
/de/
AIzaSyAYiBZKx7MnpbEhh9jyipgxe19OcubqV5w
August 1, 2025
128629
Eritrea
ERI
true
2
1
Net official flows from UN agencies, UNFPA (current US$)
2015,2014,2013,2012,2011,2010,2009,2008,2007,2006,2005,2004,2003,2002,2001,2000,1999,1998,1997,1996,1995,1994
Download
Bibliothek der Globalstatistik →Eritrea →

Net official flows from UN agencies, UNFPA (current US$)

Diese Statistik in anderen Ländern:

AfghanistanAlbaniaAlgeriaAngolaAntigua and BarbudaArab WorldArgentinaArmeniaAzerbaijanBahamas, TheBahrainBangladeshBarbadosBelarusBelizeBeninBermudaBhutanBoliviaBosnia and HerzegovinaBotswanaBrazilBritish Virgin IslandsBulgariaBurkina FasoBurundiCabo VerdeCambodiaCameroonCaribbean small statesCayman IslandsCentral African RepublicCentral Europe and the BalticsChadChileChinaColombiaComorosCongo, Dem. Rep.Congo, Rep.Costa RicaCote d'IvoireCroatiaCubaCyprusDjiboutiDominicaDominican RepublicEast Asia & PacificEast Asia & Pacific (excluding high income)East Asia & Pacific (IDA & IBRD countries)EcuadorEgypt, Arab Rep.El SalvadorEquatorial GuineaEritreaEstoniaEthiopiaEuro areaEurope & Central AsiaEurope & Central Asia (excluding high income)Europe & Central Asia (IDA & IBRD countries)European UnionFijiFragile and conflict affected situationsGabonGambia, TheGeorgiaGhanaGrenadaGuatemalaGuineaGuinea-BissauGuyanaHaitiHeavily indebted poor countries (HIPC)High incomeHondurasHong Kong SAR, ChinaHungaryIBRD onlyIDA & IBRD totalIDA blendIDA onlyIDA totalIndiaIndonesiaIran, Islamic Rep.IraqJamaicaJordanKazakhstanKenyaKiribatiKorea, Dem. People’s Rep.Korea, Rep.KosovoKuwaitKyrgyz RepublicLao PDRLatin America & Caribbean Latin America & Caribbean (excluding high income)Latin America & the Caribbean (IDA & IBRD countries)LatviaLeast developed countries: UN classificationLebanonLesothoLiberiaLibyaLithuaniaLow & middle incomeLow incomeLower middle incomeMacedonia, FYRMadagascarMalawiMalaysiaMaldivesMaliMaltaMarshall IslandsMauritaniaMauritiusMexicoMicronesia, Fed. Sts.Middle East & North AfricaMiddle East & North Africa (excluding high income)Middle East & North Africa (IDA & IBRD countries)Middle incomeMoldovaMongoliaMontenegroMoroccoMozambiqueMyanmarNamibiaNepalNicaraguaNigerNigeriaNorth AmericaNorthern Mariana IslandsOECD membersOmanOther small statesPacific island small statesPakistanPalauPanamaPapua New GuineaParaguayPeruPhilippinesPolandQatarRomaniaRussian FederationRwandaSamoaSao Tome and PrincipeSaudi ArabiaSenegalSerbiaSeychellesSierra LeoneSingaporeSmall statesSolomon IslandsSomaliaSouth AfricaSouth AsiaSouth Asia (IDA & IBRD)South SudanSri LankaSt. Kitts and NevisSt. LuciaSt. Vincent and the GrenadinesSub-Saharan Africa Sub-Saharan Africa (excluding high income)Sub-Saharan Africa (IDA & IBRD countries)SudanSurinameSwazilandSyrian Arab RepublicTajikistanTanzaniaThailandTimor-LesteTogoTongaTrinidad and TobagoTunisiaTurkeyTurkmenistanTurks and Caicos IslandsTuvaluUgandaUkraineUnited Arab EmiratesUpper middle incomeUruguayUzbekistanVanuatuVenezuela, RBVietnamWest Bank and GazaWorldYemen, Rep.ZambiaZimbabwe

Zeitlinie:

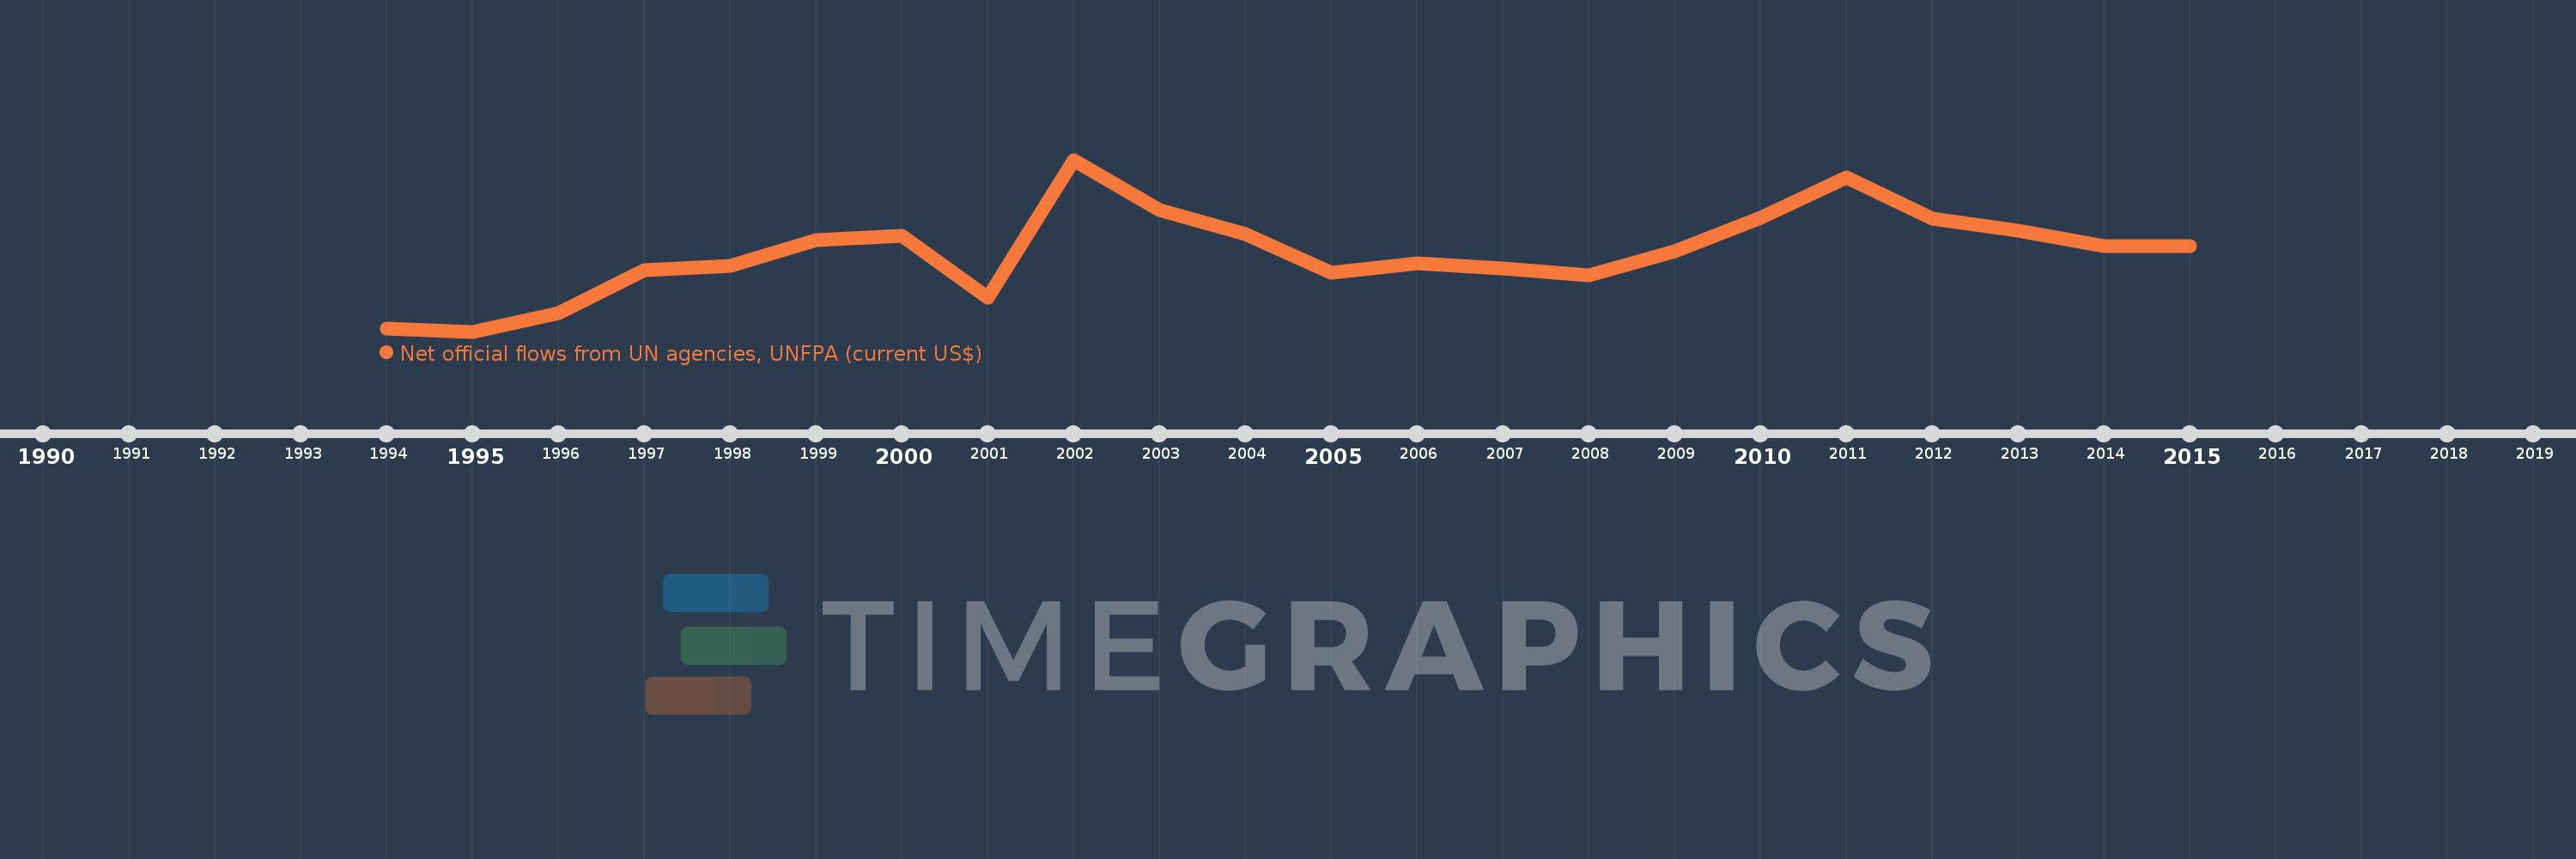
Diese Zeitleiste vorliegt die Graphik ab 1994 J. bis 2015 J. Eritrea. Die Angaben bis 1993 J. sind nicht vorhanden. Die Zahl aktueller Beobachtungen nach Daten: 22.

Die Quelle (Bezeichnung):

Kennzahlen der Weltentwicklung

Die Quelle (Einrichtung):

Development Assistance Committee of the Organisation for Economic Co-operation and Development, Geographical Distribution of Financial Flows to Developing Countries, Development Co-operation Report, and International Development Statistics database. Data are available online at: www.oecd.org/dac/stats/idsonline.

Kategorien:

Aid Effectiveness

Es wurde aktualisiert:

23 Apr 2017 Jahr

Kennzahlen der Wertänderungen vom Jahr zum Jahr

im Durchschnitt:
1.318 Mln.
Minimum:
130.0 Tsnd.
1 Jan 1995 Jahr
Maximum:
2.71 Mln.
1 Jan 2002 Jahr
Zum Datum der Beobachtung
Wert
Absolute Veränderung
Die Veränderung bezüglich dem vorherigen Wert
1 Jan 1994 Jahr
180.0 Tsnd.
+180.0 Tsnd.
0.0%
1 Jan 1995 Jahr
130.0 Tsnd.
-50.0 Tsnd.
-27.78%
1 Jan 1996 Jahr
410.0 Tsnd.
+280.0 Tsnd.
215.38%
1 Jan 1997 Jahr
1.05 Mln.
+640.0 Tsnd.
156.1%
1 Jan 1998 Jahr
1.12 Mln.
+70.0 Tsnd.
6.67%
1 Jan 1999 Jahr
1.5 Mln.
+380.0 Tsnd.
33.93%
1 Jan 2000 Jahr
1.57 Mln.
+70.0 Tsnd.
4.67%
1 Jan 2001 Jahr
640.0 Tsnd.
-930.0 Tsnd.
-59.24%
1 Jan 2002 Jahr
2.71 Mln.
+2.07 Mln.
323.44%
1 Jan 2003 Jahr
1.96 Mln.
-750.0 Tsnd.
-27.68%
1 Jan 2004 Jahr
1.59 Mln.
-370.0 Tsnd.
-18.88%
1 Jan 2005 Jahr
1.02 Mln.
-570.0 Tsnd.
-35.85%
1 Jan 2006 Jahr
1.16 Mln.
+140.0 Tsnd.
13.73%
1 Jan 2007 Jahr
1.08 Mln.
-80.0 Tsnd.
-6.9%
1 Jan 2008 Jahr
980.0 Tsnd.
-100.0 Tsnd.
-9.26%
1 Jan 2009 Jahr
1.33 Mln.
+350.0 Tsnd.
35.71%
1 Jan 2010 Jahr
1.84 Mln.
+510.0 Tsnd.
38.35%
1 Jan 2011 Jahr
2.44 Mln.
+600.0 Tsnd.
32.61%
1 Jan 2012 Jahr
1.83 Mln.
-610.0 Tsnd.
-25.0%
1 Jan 2013 Jahr
1.64 Mln.
-190.0 Tsnd.
-10.38%
1 Jan 2014 Jahr
1.41 Mln.
-230.0 Tsnd.
-14.02%
1 Jan 2015 Jahr
1.41 Mln.
0.0
0.0%

Bewertung der Länder gemäß mit laufender Statistik nach Jahren