29
/
en
AIzaSyAYiBZKx7MnpbEhh9jyipgxe19OcubqV5w
April 1, 2024
97858
Cabo Verde
CPV
true
2
1
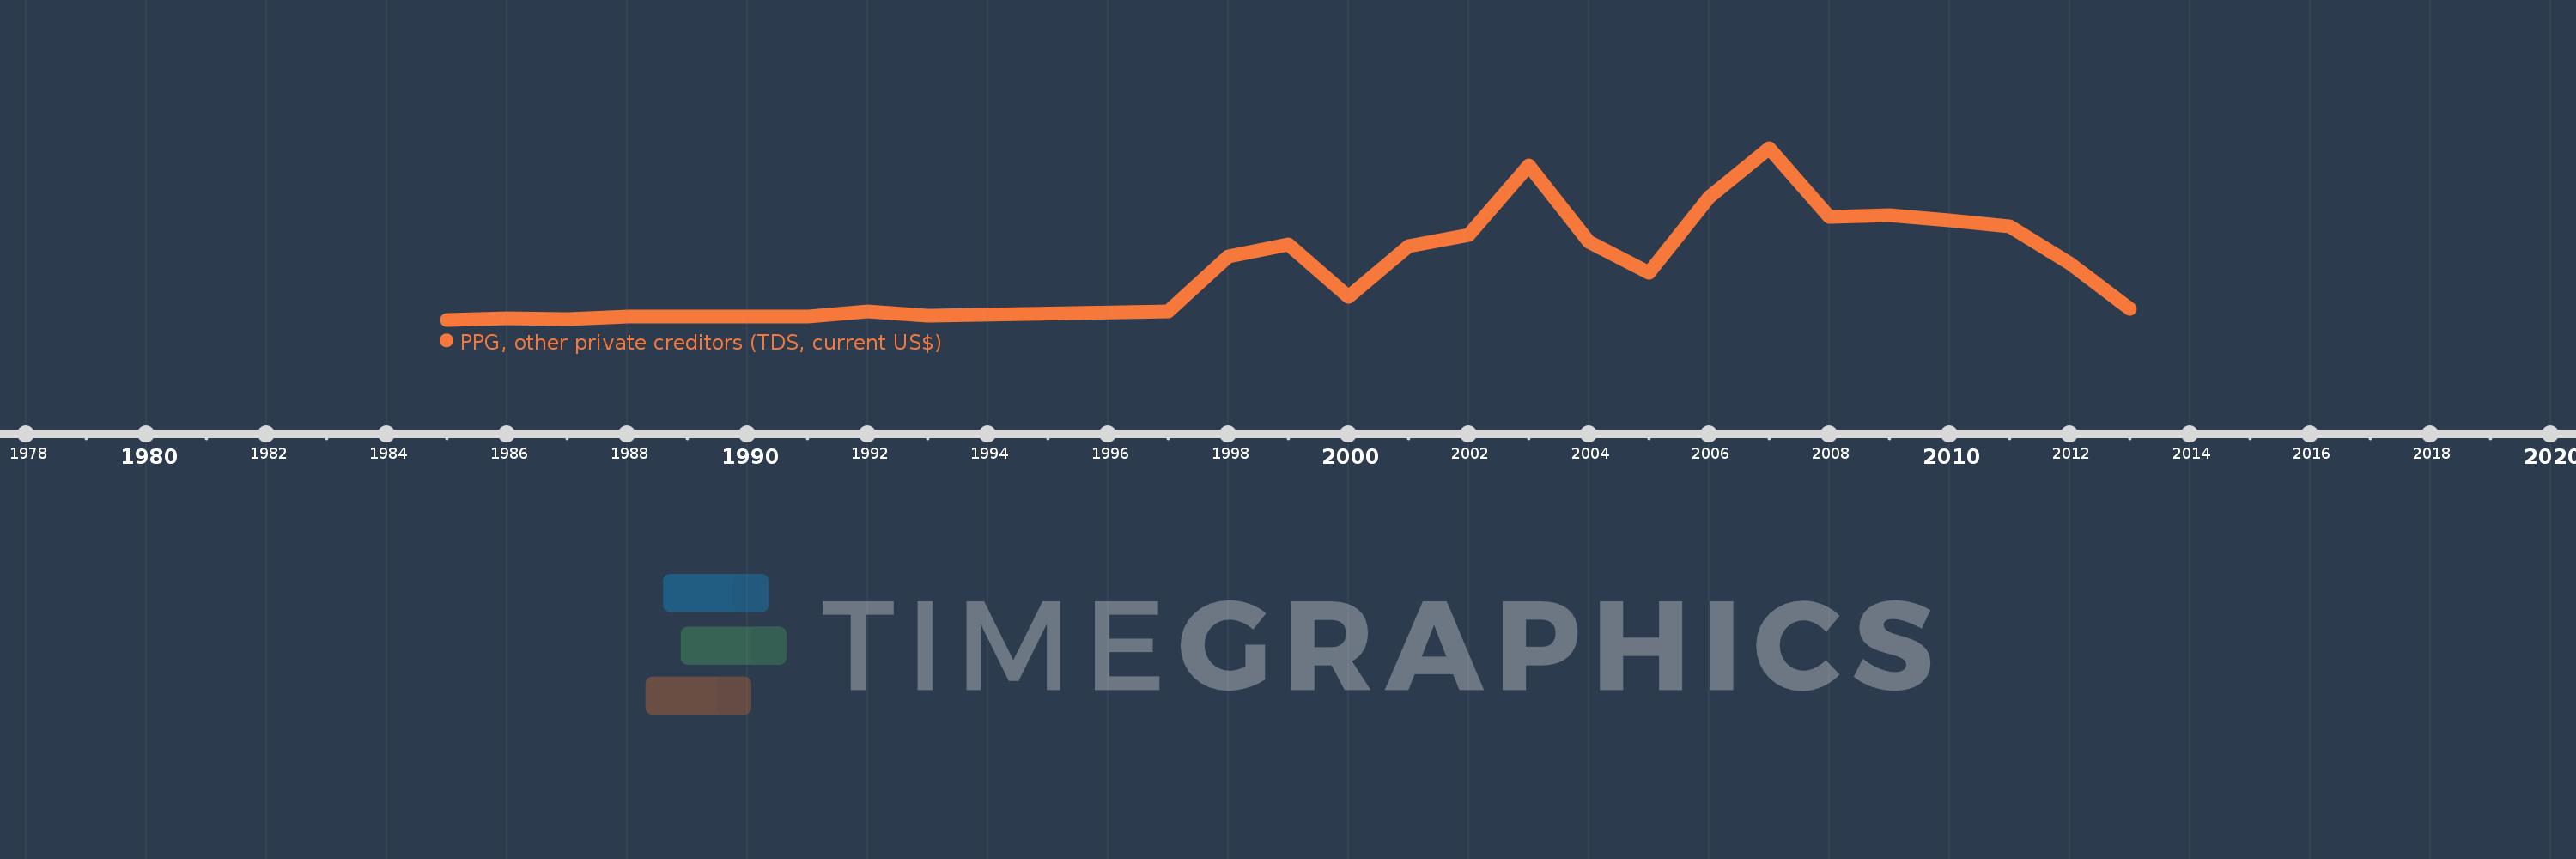
PPG, other private creditors (TDS, current US$)
2013,2012,2011,2010,2009,2008,2007,2006,2005,2004,2003,2002,2001,2000,1999,1998,1997,1993,1992,1991,1990,1989,1988,1987,1986,1985
This statistics in other country:
Timeline:
This timeline shows a graph from 1985 to 2013 of Cabo Verde. No data until 1984. Number of actual observations by date: 26.
Source name:
World Development Indicators
Source organization:
World Bank, International Debt Statistics.
Categories, topics:
External Debt
Last updated:
apr 23, 2017
Indicators value changes by year
Maximum:
6.32 mln
jan 1, 2007
At the date of observation
Value
Absolute change
Change from previous value
jan 1, 1985
34.0K
+34.0K
0.0%
jan 1, 1986
81.0K
+47.0K
138.24%
jan 1, 1987
62.0K
-19.0K
-23.46%
jan 1, 1988
158.0K
+96.0K
154.84%
jan 1, 1989
163.0K
+5.0K
3.16%
jan 1, 1990
150.0K
-13.0K
-7.98%
jan 1, 1991
150.0K
0.0
0.0%
jan 1, 1992
339.0K
+189.0K
126.0%
jan 1, 1993
177.0K
-162.0K
-47.79%
jan 1, 1997
325.0K
+148.0K
83.62%
jan 1, 1998
2.353 mln
+2.028 mln
624.0%
jan 1, 1999
2.787 mln
+434.0K
18.44%
jan 1, 2000
870.0K
-1.917 mln
-68.78%
jan 1, 2001
2.731 mln
+1.861 mln
213.91%
jan 1, 2002
3.128 mln
+397.0K
14.54%
jan 1, 2003
5.667 mln
+2.539 mln
81.17%
jan 1, 2004
2.896 mln
-2.771 mln
-48.9%
jan 1, 2005
1.745 mln
-1.151 mln
-39.74%
jan 1, 2006
4.53 mln
+2.785 mln
159.6%
jan 1, 2007
6.32 mln
+1.79 mln
39.51%
jan 1, 2008
3.789 mln
-2.531 mln
-40.05%
jan 1, 2009
3.857 mln
+68.0K
1.79%
jan 1, 2010
3.668 mln
-189.0K
-4.9%
jan 1, 2011
3.444 mln
-224.0K
-6.11%
jan 1, 2012
2.102 mln
-1.342 mln
-38.97%
jan 1, 2013
435.0K
-1.667 mln
-79.31%
Ranking of countries by current statistics by years


Comments: