29
/
en
AIzaSyAYiBZKx7MnpbEhh9jyipgxe19OcubqV5w
April 1, 2024
198140
Moldova
MDA
true
2
1
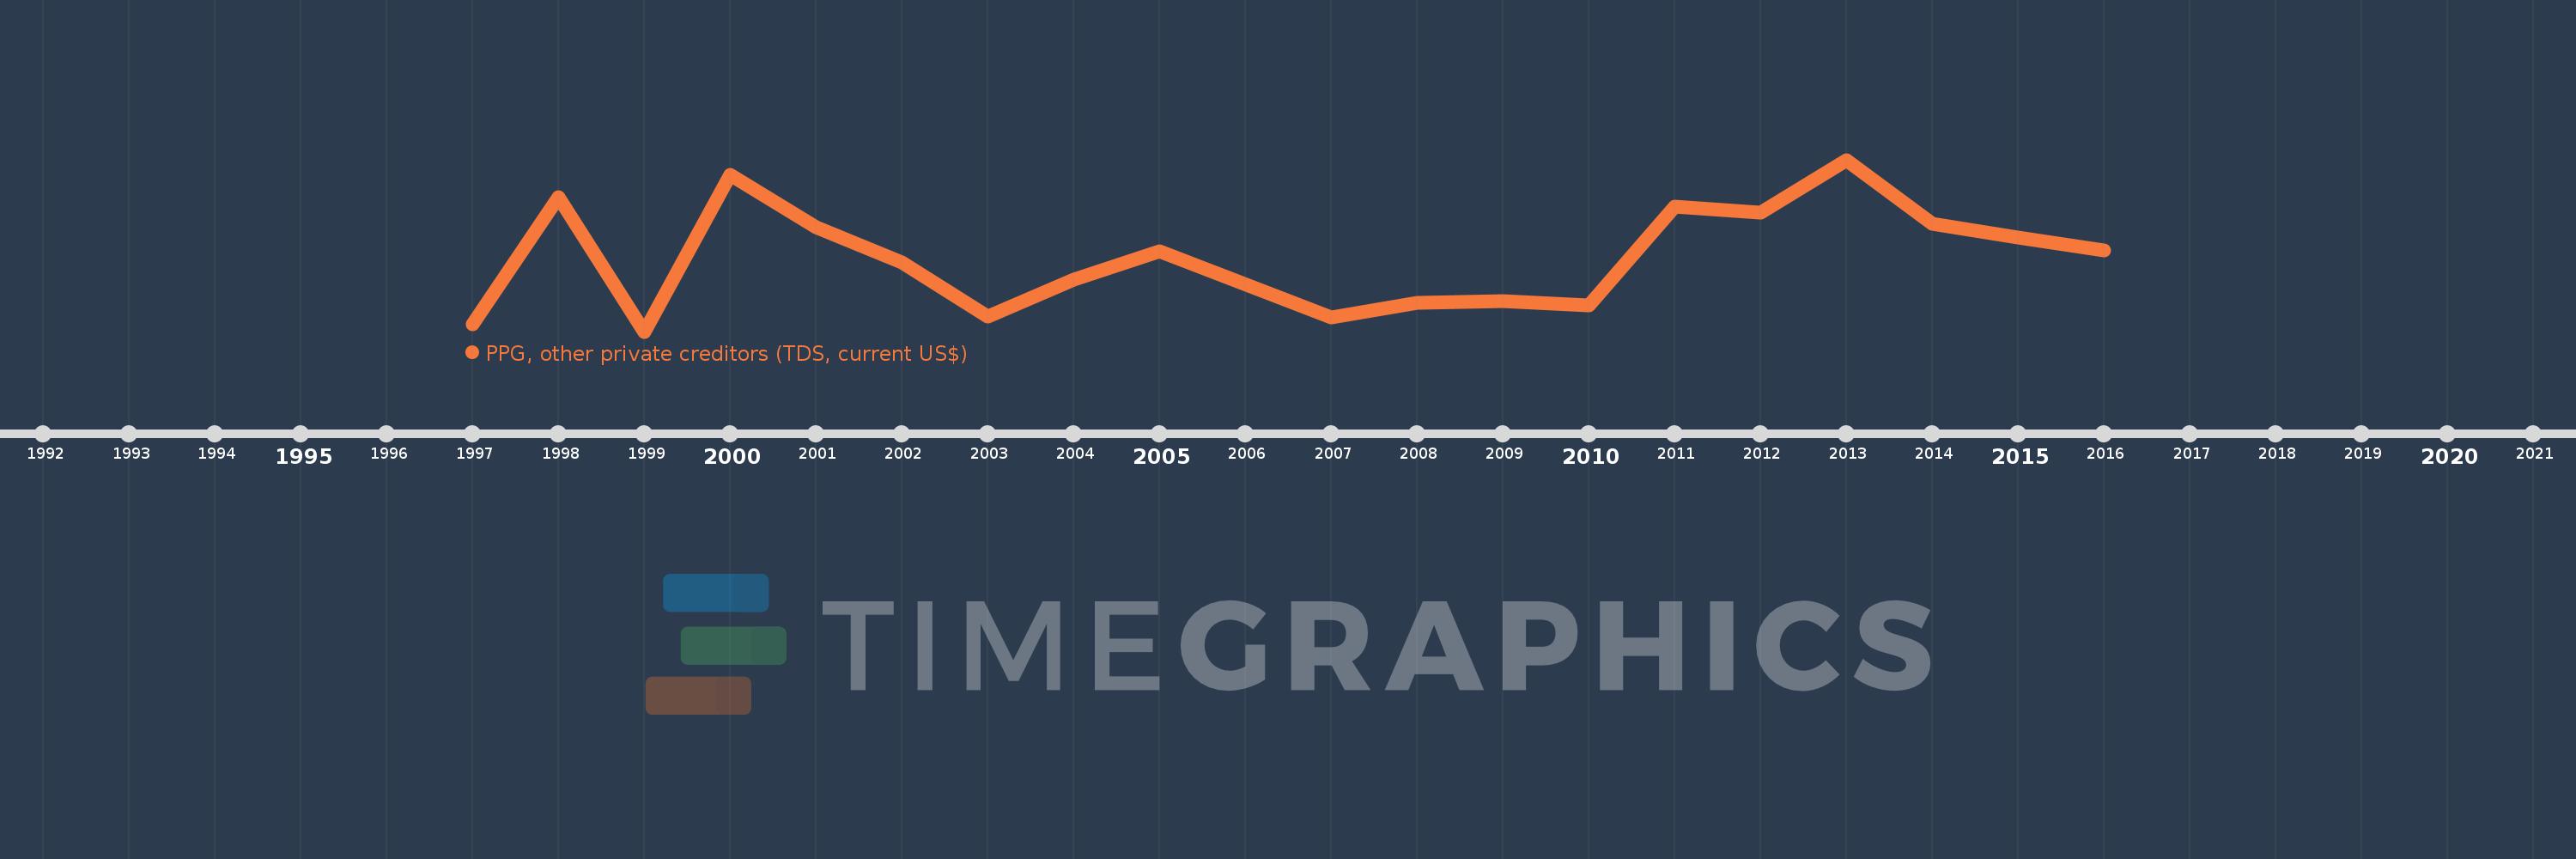
PPG, other private creditors (TDS, current US$)
2016,2015,2014,2013,2012,2011,2010,2009,2008,2007,2005,2004,2003,2002,2001,2000,1999,1998,1997
This statistics in other country:
Timeline:
This timeline shows a graph from 1997 to 2016 of Moldova. No data until 1996. Number of actual observations by date: 19.
Source name:
World Development Indicators
Source organization:
World Bank, International Debt Statistics.
Categories, topics:
External Debt
Last updated:
apr 23, 2017
Indicators value changes by year
Minimum:
492.0K
jan 1, 1999
Maximum:
10.453 mln
jan 1, 2013
At the date of observation
Value
Absolute change
Change from previous value
jan 1, 1997
911.0K
+911.0K
0.0%
jan 1, 1998
8.301 mln
+7.39 mln
811.2%
jan 1, 1999
492.0K
-7.809 mln
-94.07%
jan 1, 2000
9.58 mln
+9.088 mln
1.85K%
jan 1, 2001
6.53 mln
-3.05 mln
-31.84%
jan 1, 2002
4.507 mln
-2.023 mln
-30.98%
jan 1, 2003
1.377 mln
-3.13 mln
-69.45%
jan 1, 2004
3.524 mln
+2.147 mln
155.92%
jan 1, 2005
5.134 mln
+1.61 mln
45.69%
jan 1, 2007
1.325 mln
-3.809 mln
-74.19%
jan 1, 2008
2.15 mln
+825.0K
62.26%
jan 1, 2009
2.258 mln
+108.0K
5.02%
jan 1, 2010
1.999 mln
-259.0K
-11.47%
jan 1, 2011
7.74 mln
+5.741 mln
287.19%
jan 1, 2012
7.396 mln
-344.0K
-4.44%
jan 1, 2013
10.453 mln
+3.057 mln
41.33%
jan 1, 2014
6.747 mln
-3.706 mln
-35.45%
jan 1, 2015
5.954 mln
-793.0K
-11.75%
jan 1, 2016
5.186 mln
-768.0K
-12.9%
Ranking of countries by current statistics by years


Comments: