29
/
en
AIzaSyAYiBZKx7MnpbEhh9jyipgxe19OcubqV5w
April 1, 2024
94503
Burkina Faso
BFA
true
2
1
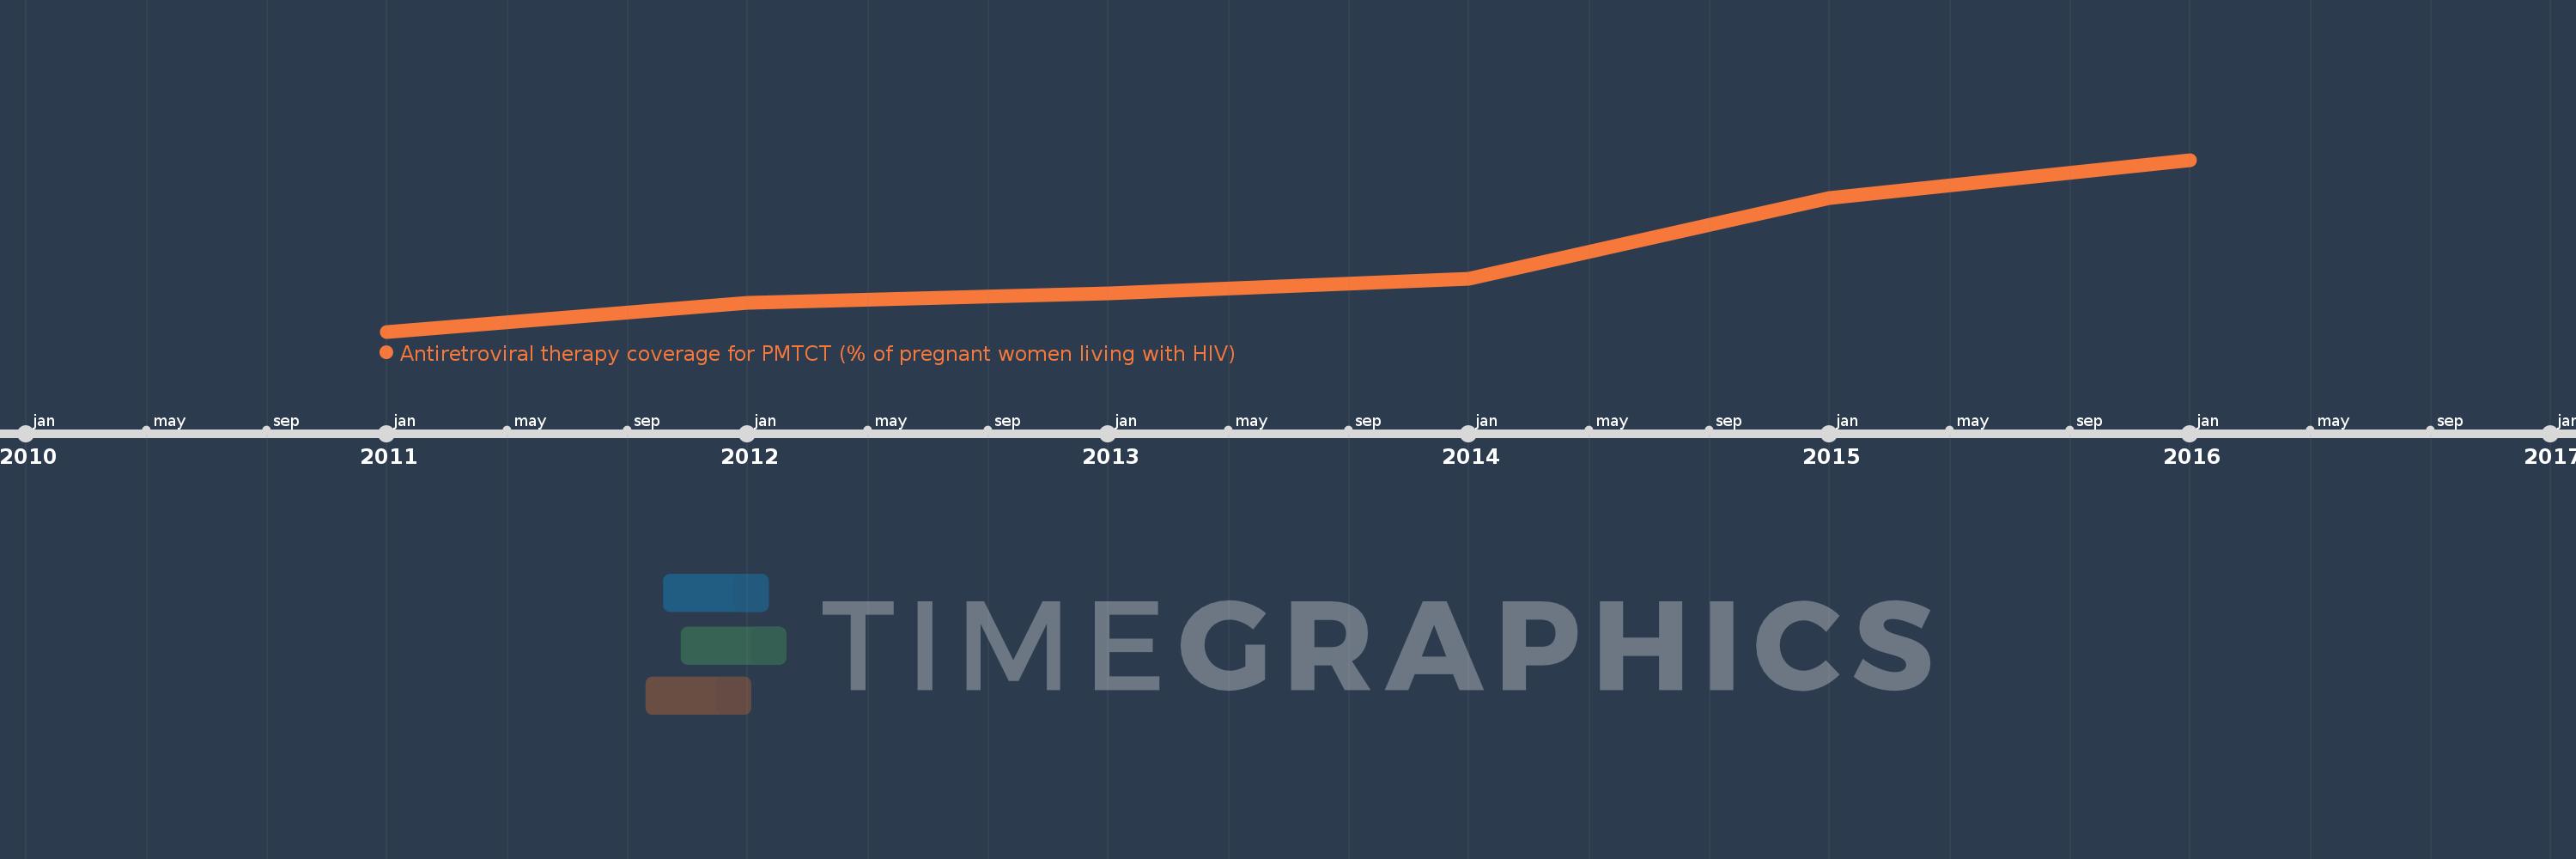
Antiretroviral therapy coverage for PMTCT (% of pregnant women living with HIV)
2016,2015,2014,2013,2012,2011
This statistics in other country:
Timeline:
This timeline shows a graph from 2011 to 2016 of Burkina Faso. No data until 2010. Number of actual observations by date: 6.
Source name:
World Development Indicators
Source organization:
UNAIDS estimates.
Categories, topics:
Health
Last updated:
apr 23, 2017
Indicators value changes by year
At the date of observation
Value
Absolute change
Change from previous value
jan 1, 2011
53.0
+53.0
0.0%
jan 1, 2012
59.0
+6.0
11.32%
jan 1, 2013
61.0
+2.0
3.39%
jan 1, 2014
64.0
+3.0
4.92%
jan 1, 2015
81.0
+17.0
26.56%
jan 1, 2016
89.0
+8.0
9.88%
Ranking of countries by current statistics by years


Comments: