29
/
en
AIzaSyAYiBZKx7MnpbEhh9jyipgxe19OcubqV5w
April 1, 2024
39719
IDA total
IDA
false
2
1
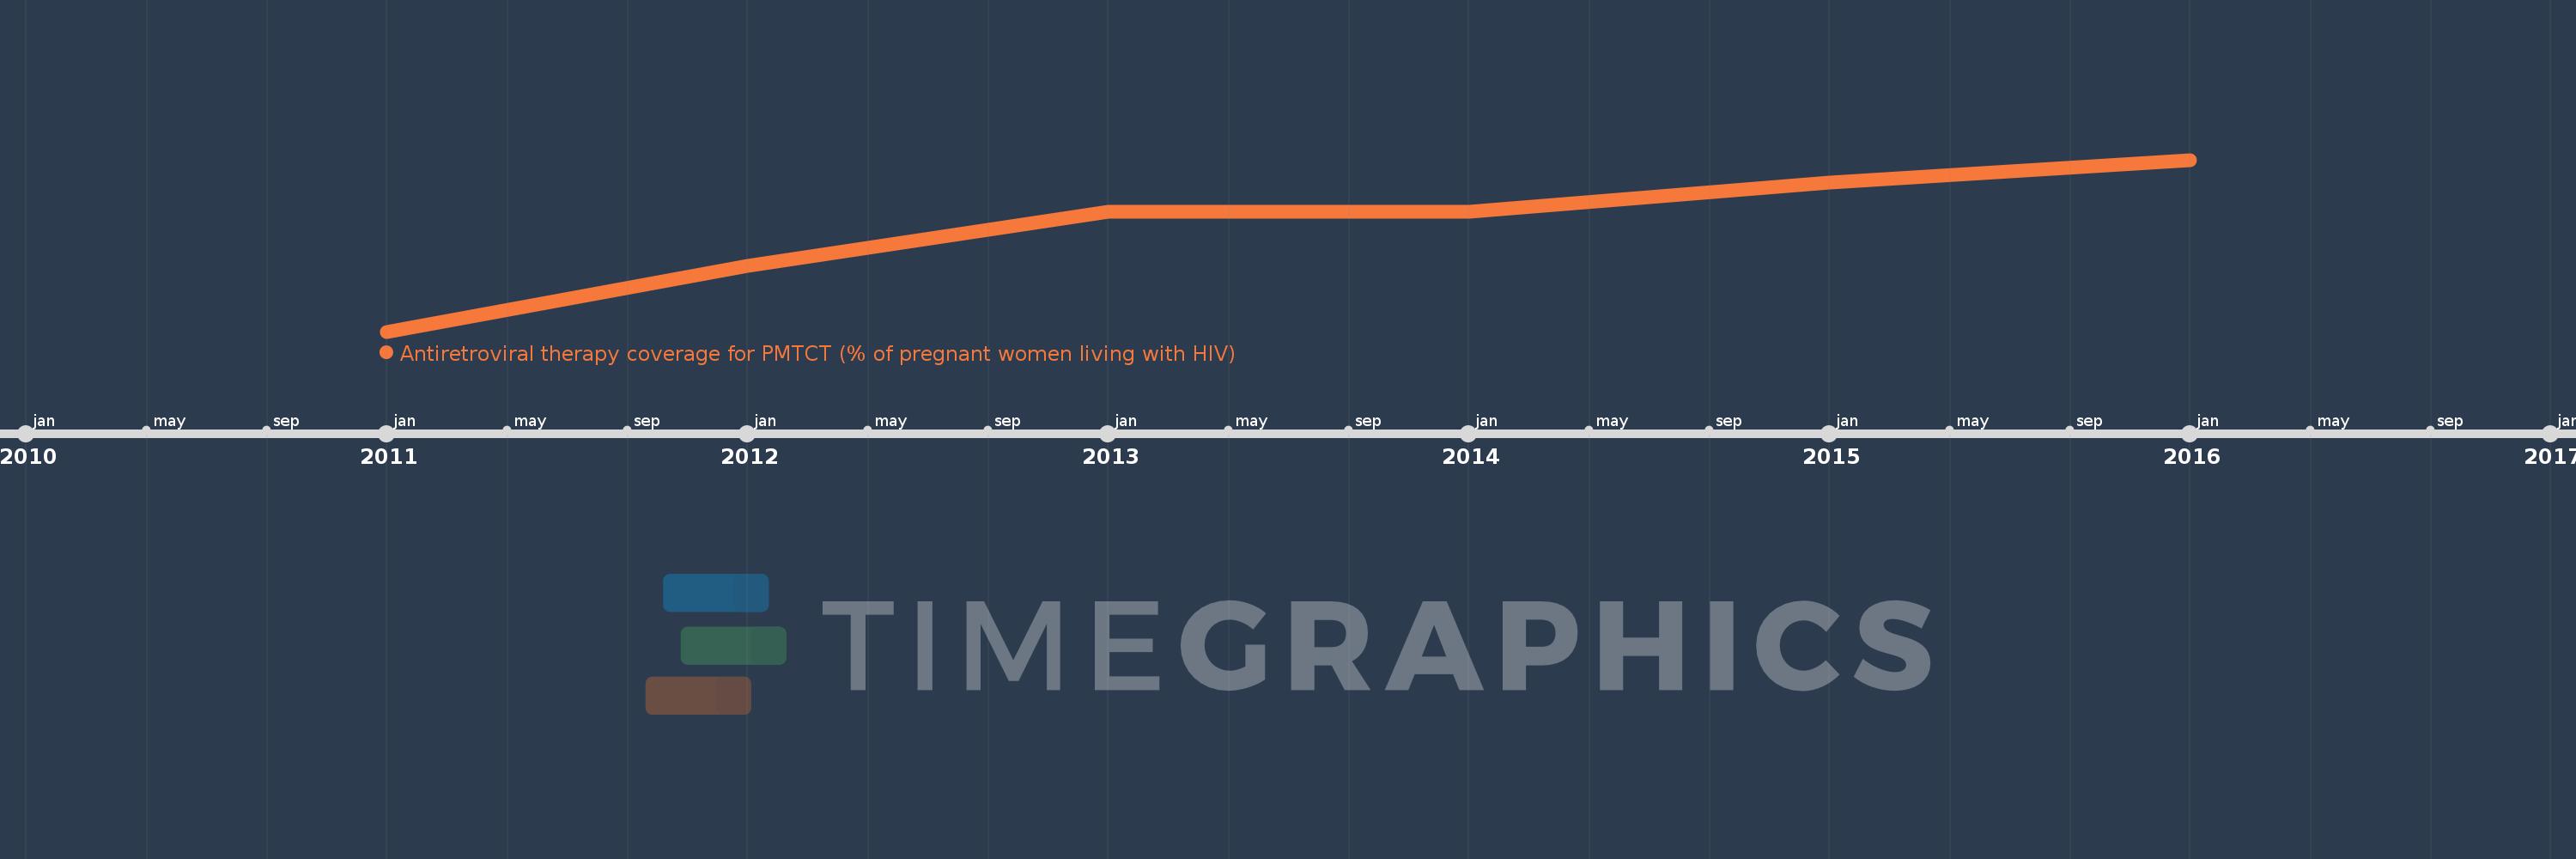
Antiretroviral therapy coverage for PMTCT (% of pregnant women living with HIV)
2016,2015,2014,2013,2012,2011
This statistics in other country:
Timeline:
This timeline shows a graph from 2011 to 2016 of IDA total. No data until 2010. Number of actual observations by date: 6.
Source name:
World Development Indicators
Source organization:
UNAIDS estimates.
Categories, topics:
Health
Last updated:
apr 23, 2017
Indicators value changes by year
Minimum:
42.903
jan 1, 2011
Maximum:
81.946
jan 1, 2016
At the date of observation
Value
Absolute change
Change from previous value
jan 1, 2011
42.903
+42.903
0.0%
jan 1, 2012
57.908
+15.006
34.98%
jan 1, 2013
70.227
+12.319
21.27%
jan 1, 2014
70.179
-0.048
-0.07%
jan 1, 2015
76.827
+6.648
9.47%
jan 1, 2016
81.946
+5.119
6.66%
Ranking of countries by current statistics by years


Comments: