29
/
en
AIzaSyAYiBZKx7MnpbEhh9jyipgxe19OcubqV5w
April 1, 2024
94041
Bulgaria
BGR
true
2
1
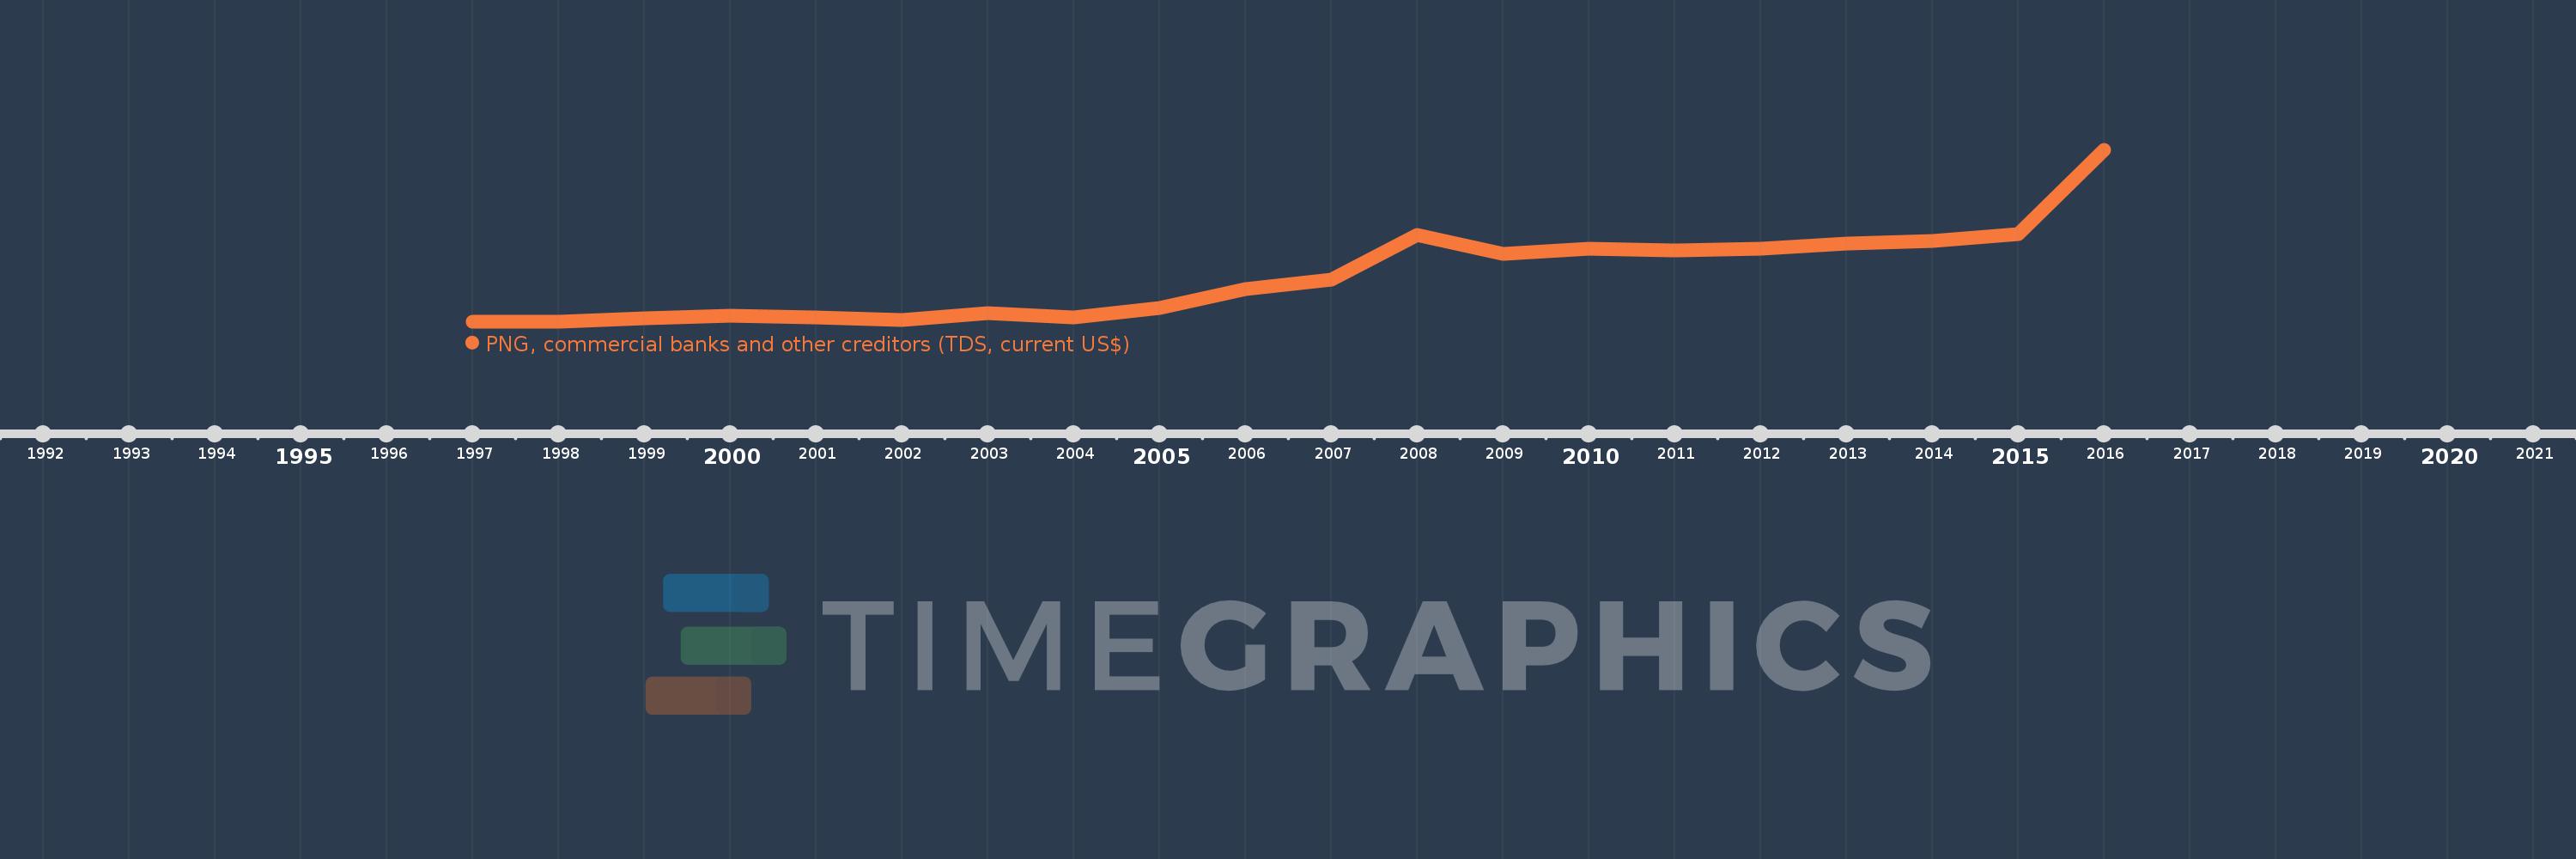
PNG, commercial banks and other creditors (TDS, current US$)
2016,2015,2014,2013,2012,2011,2010,2009,2008,2007,2006,2005,2004,2003,2002,2001,2000,1999,1998,1997
This statistics in other country:
Timeline:
This timeline shows a graph from 1997 to 2016 of Bulgaria. No data until 1996. Number of actual observations by date: 20.
Source name:
World Development Indicators
Source organization:
World Bank, International Debt Statistics.
Categories, topics:
External Debt
Last updated:
apr 23, 2017
Indicators value changes by year
Minimum:
34.31 mln
jan 1, 1998
Maximum:
8.846 bln
jan 1, 2016
At the date of observation
Value
Absolute change
Change from previous value
jan 1, 1997
42.878 mln
+42.878 mln
0.0%
jan 1, 1998
34.31 mln
-8.568 mln
-19.98%
jan 1, 1999
222.049 mln
+187.739 mln
547.18%
jan 1, 2000
337.047 mln
+114.998 mln
51.79%
jan 1, 2001
260.713 mln
-76.334 mln
-22.65%
jan 1, 2002
132.241 mln
-128.472 mln
-49.28%
jan 1, 2003
476.537 mln
+344.296 mln
260.35%
jan 1, 2004
254.517 mln
-222.02 mln
-46.59%
jan 1, 2005
761.673 mln
+507.156 mln
199.26%
jan 1, 2006
1.7 bln
+938.098 mln
123.16%
jan 1, 2007
2.212 bln
+511.802 mln
30.11%
jan 1, 2008
4.502 bln
+2.29 bln
103.55%
jan 1, 2009
3.541 bln
-960.549 mln
-21.34%
jan 1, 2010
3.776 bln
+235.036 mln
6.64%
jan 1, 2011
3.701 bln
-75.234 mln
-1.99%
jan 1, 2012
3.791 bln
+89.999 mln
2.43%
jan 1, 2013
4.044 bln
+253.504 mln
6.69%
jan 1, 2014
4.167 bln
+122.491 mln
3.03%
jan 1, 2015
4.547 bln
+380.378 mln
9.13%
jan 1, 2016
8.846 bln
+4.298 bln
94.53%
Ranking of countries by current statistics by years


Comments: