29
/
en
AIzaSyAYiBZKx7MnpbEhh9jyipgxe19OcubqV5w
April 1, 2024
165330
Jordan
JOR
true
2
1
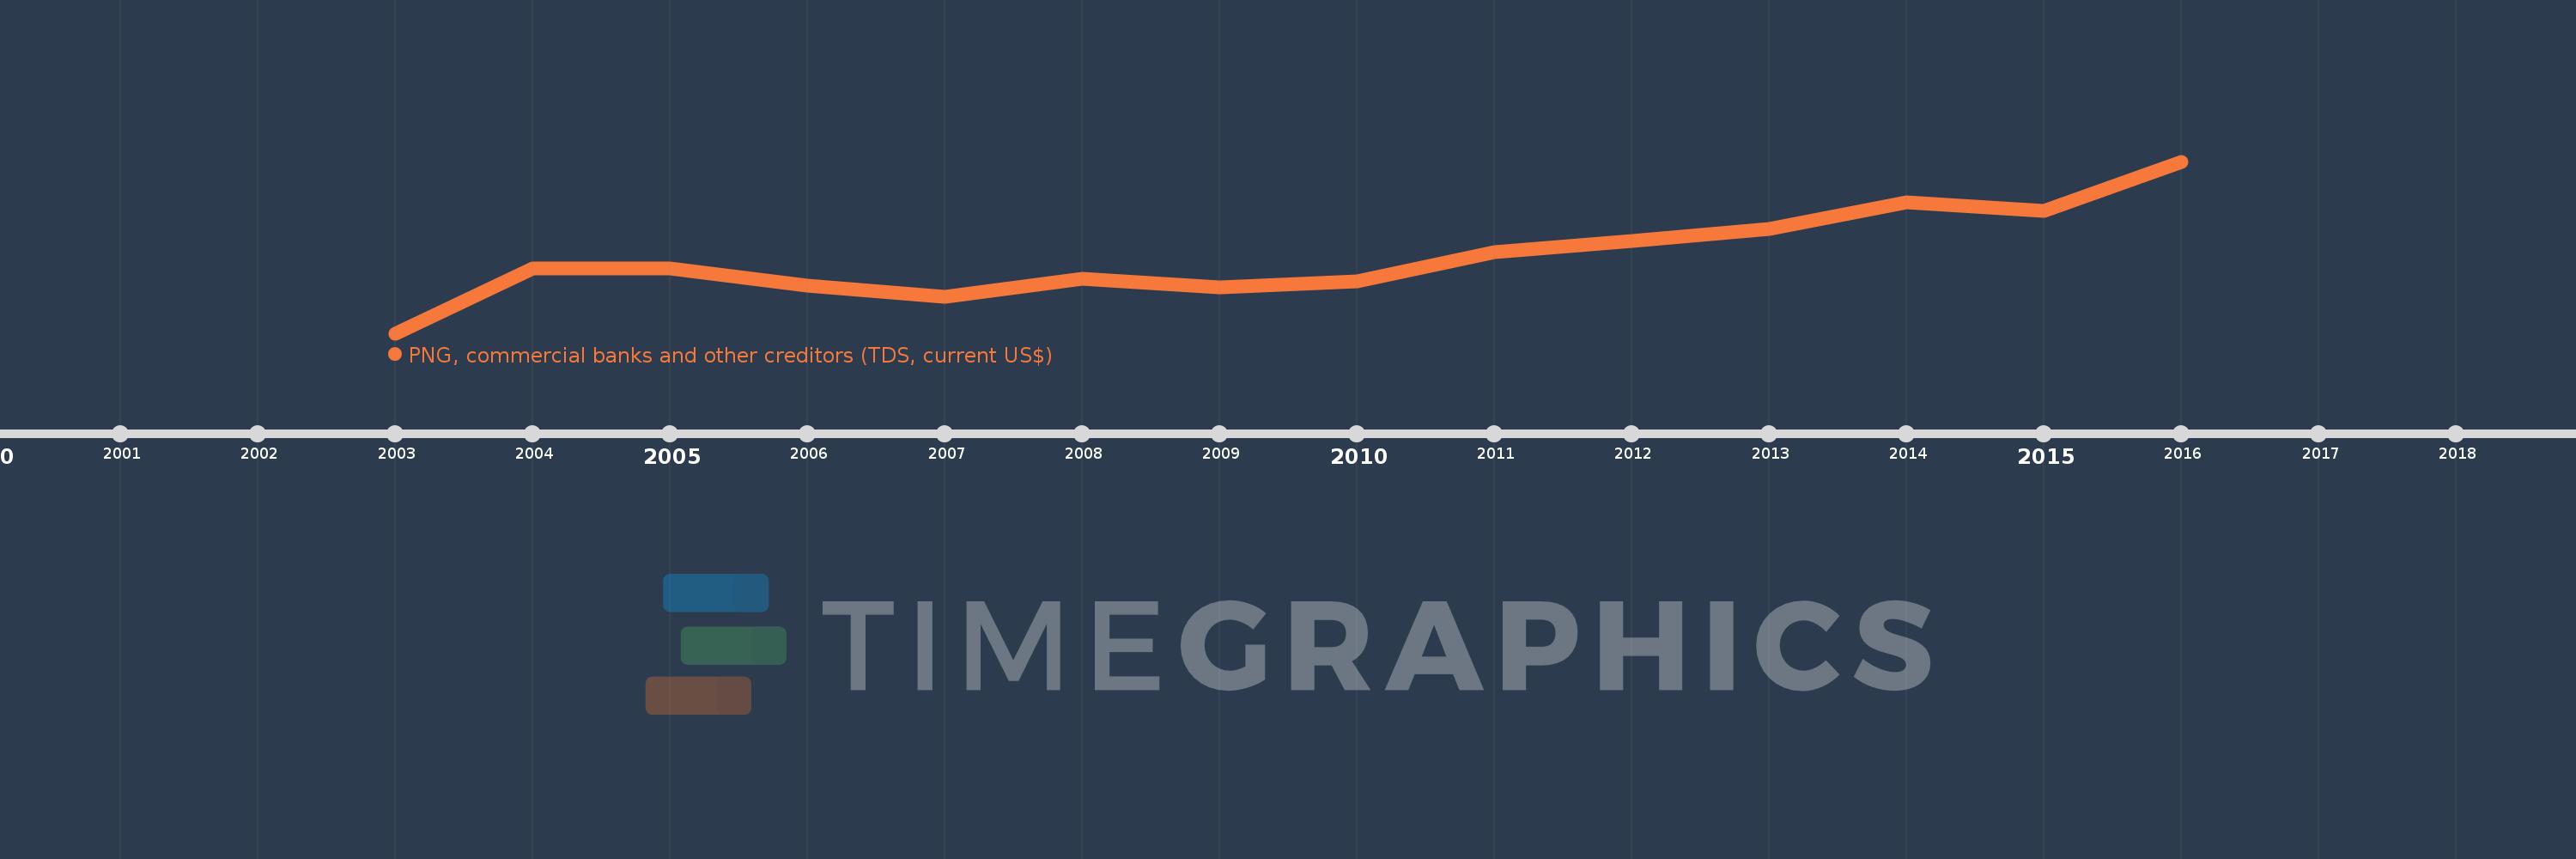
PNG, commercial banks and other creditors (TDS, current US$)
2016,2015,2014,2013,2012,2011,2010,2009,2008,2007,2006,2005,2004,2003
This statistics in other country:
Timeline:
This timeline shows a graph from 2003 to 2016 of Jordan. No data until 2002. Number of actual observations by date: 14.
Source name:
World Development Indicators
Source organization:
World Bank, International Debt Statistics.
Categories, topics:
External Debt
Last updated:
apr 23, 2017
Indicators value changes by year
Minimum:
2.783 mln
jan 1, 2003
Maximum:
86.566 mln
jan 1, 2016
At the date of observation
Value
Absolute change
Change from previous value
jan 1, 2003
2.783 mln
+2.783 mln
0.0%
jan 1, 2004
34.499 mln
+31.716 mln
1.14K%
jan 1, 2005
34.409 mln
-90.0K
-0.26%
jan 1, 2006
26.0 mln
-8.409 mln
-24.44%
jan 1, 2007
20.752 mln
-5.248 mln
-20.18%
jan 1, 2008
29.273 mln
+8.521 mln
41.06%
jan 1, 2009
25.37 mln
-3.903 mln
-13.33%
jan 1, 2010
27.921 mln
+2.551 mln
10.06%
jan 1, 2011
42.478 mln
+14.557 mln
52.14%
jan 1, 2012
47.951 mln
+5.473 mln
12.88%
jan 1, 2013
53.632 mln
+5.681 mln
11.85%
jan 1, 2014
66.583 mln
+12.951 mln
24.15%
jan 1, 2015
62.638 mln
-3.945 mln
-5.92%
jan 1, 2016
86.566 mln
+23.928 mln
38.2%
Ranking of countries by current statistics by years


Comments: