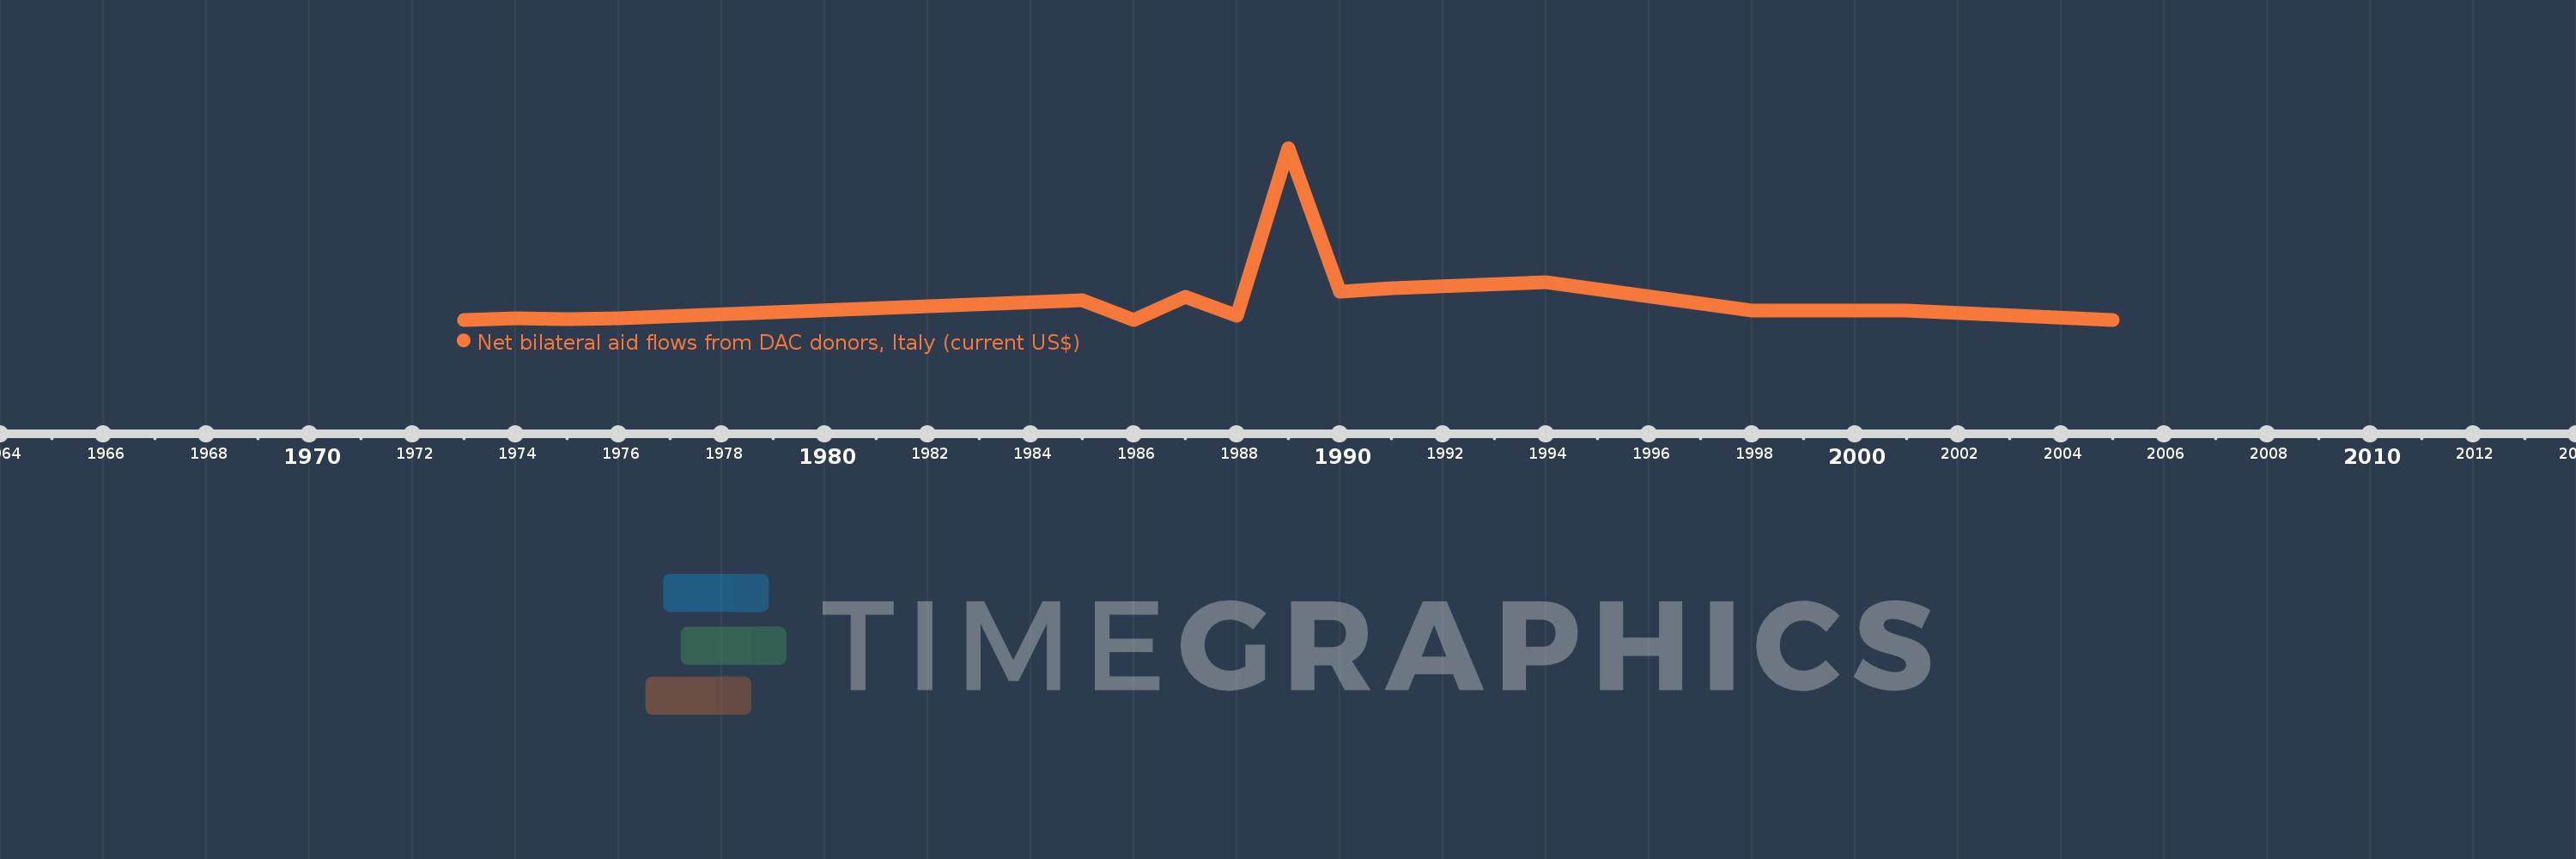
This timeline shows a graph from 1973 to 2005 of Botswana. No data until 1972. Number of actual observations by date: 15.
Source name:
World Development Indicators
Source organization:
Development Assistance Committee of the Organisation for Economic Co-operation and Development, Geographical Distribution of Financial Flows to Developing Countries, Development Co-operation Report, and International Development Statistics database. Data are available online at: www.oecd.org/dac/stats/idsonline.
Categories, topics:
Aid Effectiveness
Last updated:
apr 23, 2017
Indicators value changes by year
Meaning:
252.667K
Minimum:
10.0K
jan 1, 1973
Maximum:
1.86 mln
jan 1, 1989
At the date of observation
Value
Absolute change
Change from the previous value
jan 1, 1973
10.0K
+10.0K
0.0%
jan 1, 1974
30.0K
+20.0K
200.0%
jan 1, 1975
20.0K
-10.0K
-33.33%
jan 1, 1976
30.0K
+10.0K
50.0%
jan 1, 1985
220.0K
+190.0K
633.33%
jan 1, 1986
10.0K
-210.0K
-95.45%
jan 1, 1987
260.0K
+250.0K
2.5K%
jan 1, 1988
50.0K
-210.0K
-80.77%
jan 1, 1989
1.86 mln
+1.81 mln
3.62K%
jan 1, 1990
310.0K
-1.55 mln
-83.33%
jan 1, 1991
350.0K
+40.0K
12.9%
jan 1, 1994
410.0K
+60.0K
17.14%
jan 1, 1998
110.0K
-300.0K
-73.17%
jan 1, 2001
110.0K
0.0
0.0%
jan 1, 2005
10.0K
-100.0K
-90.91%
Ranking of countries by current statistics by years
