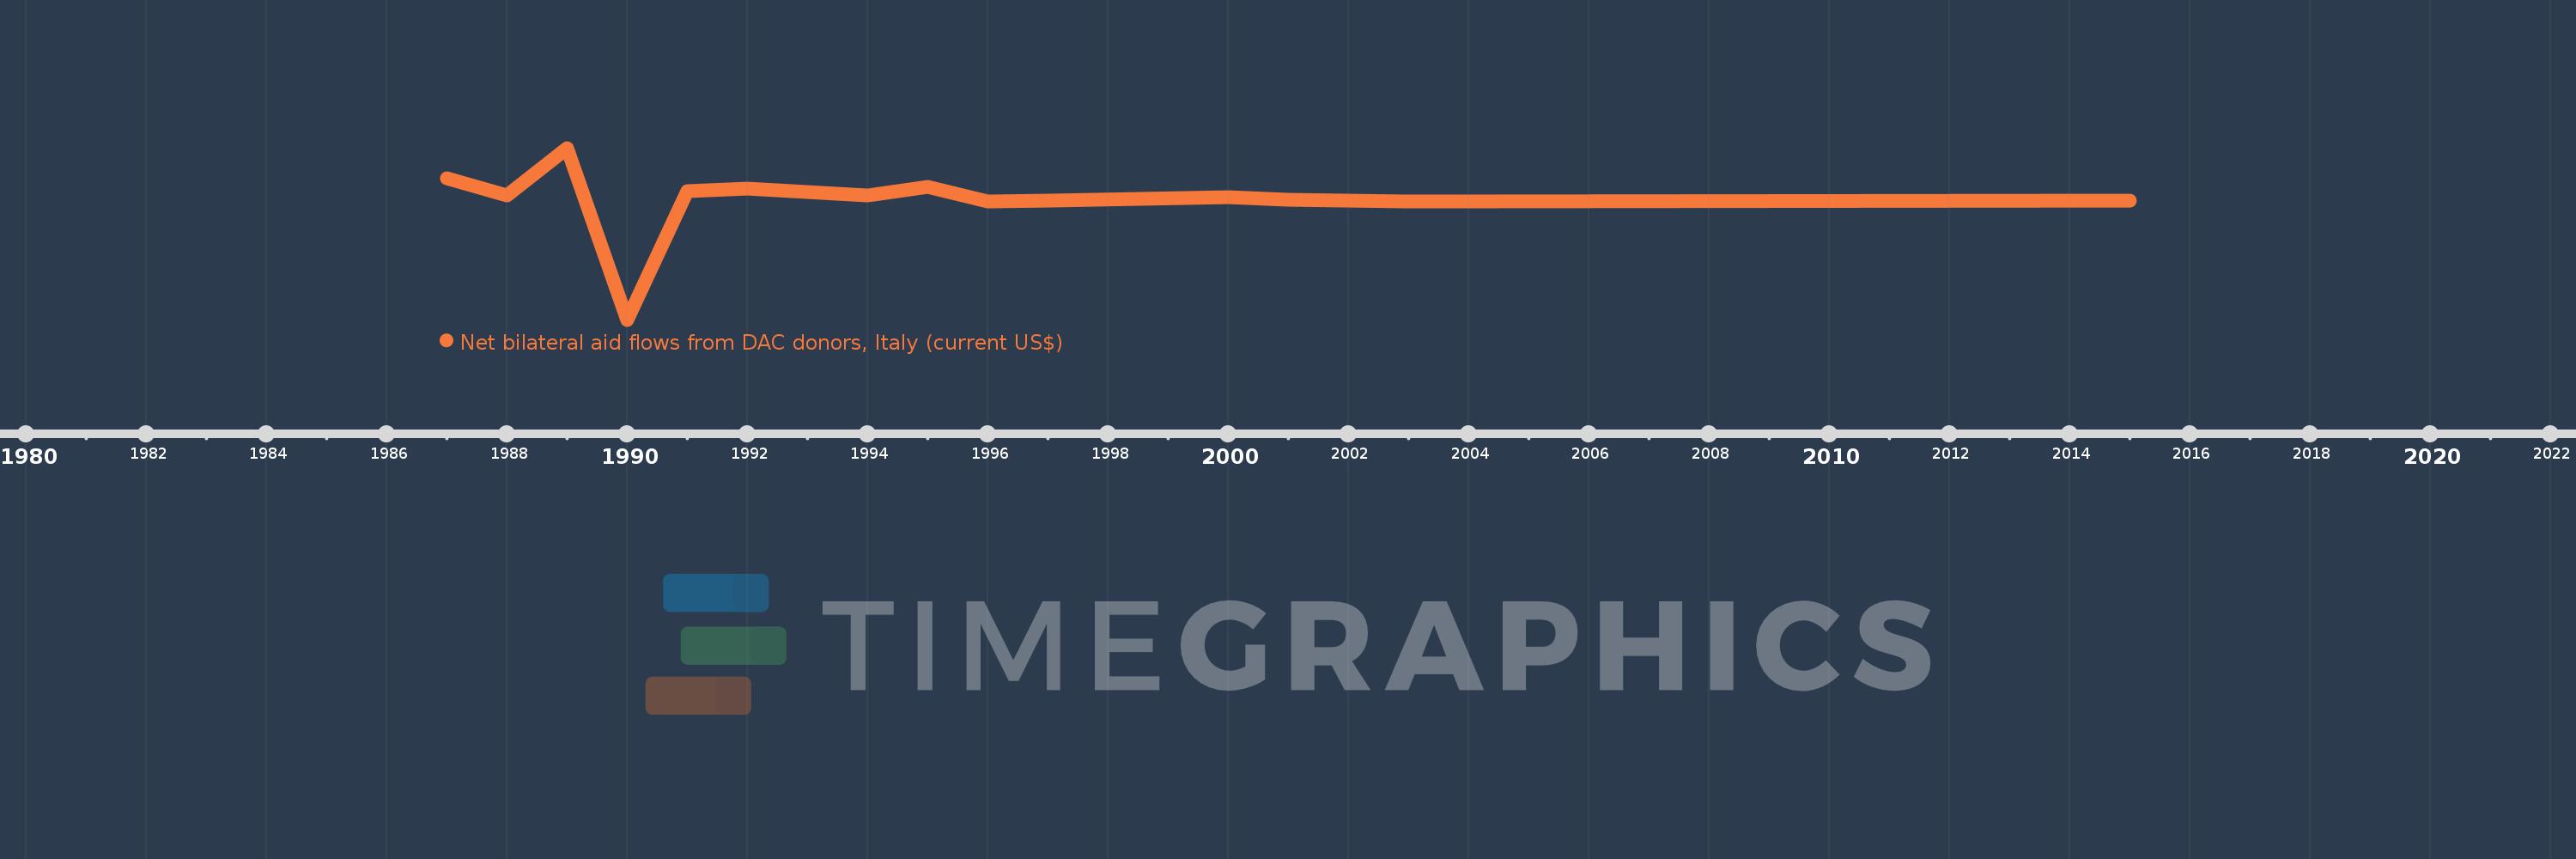
This timeline shows a graph from 1987 to 2015 of Bhutan. No data until 1986. Number of actual observations by date: 15.
Source name:
World Development Indicators
Source organization:
Development Assistance Committee of the Organisation for Economic Co-operation and Development, Geographical Distribution of Financial Flows to Developing Countries, Development Co-operation Report, and International Development Statistics database. Data are available online at: www.oecd.org/dac/stats/idsonline.
Categories, topics:
Aid Effectiveness
Last updated:
apr 23, 2017
Indicators value changes by year
Meaning:
22.667K
Minimum:
-1.73 mln
jan 1, 1990
Maximum:
790.0K
jan 1, 1989
At the date of observation
Value
Absolute change
Change from the previous value
jan 1, 1987
340.0K
+340.0K
0.0%
jan 1, 1988
90.0K
-250.0K
-73.53%
jan 1, 1989
790.0K
+700.0K
777.78%
jan 1, 1990
-1.73 mln
-2.52 mln
-318.99%
jan 1, 1991
160.0K
+1.89 mln
-109.25%
jan 1, 1992
200.0K
+40.0K
25.0%
jan 1, 1994
90.0K
-110.0K
-55.0%
jan 1, 1995
220.0K
+130.0K
144.44%
jan 1, 1996
10.0K
-210.0K
-95.45%
jan 1, 1997
20.0K
+10.0K
100.0%
jan 1, 2000
70.0K
+50.0K
250.0%
jan 1, 2001
30.0K
-40.0K
-57.14%
jan 1, 2002
20.0K
-10.0K
-33.33%
jan 1, 2003
10.0K
-10.0K
-50.0%
jan 1, 2015
20.0K
+10.0K
100.0%
Ranking of countries by current statistics by years
